


 826 844

not be accepted), and at 2, 4, and 8 wk, and 6 and 12 mo. In the second
and fourth weeks, patients completed the questionnaires via a telephone
call with the study nurse. The IIEF-5 questionnaire was also completed at
8 wk and 6 and 12 mo after surgery. The questionnaire and questions
concerning pad usewere posed by the study nurse, whowas blinded to the
type of operation. The questionnaires were adapted so that the time
referred to in the questions was limited to the end of the intervisit period.
2.4.
Statistical evaluation
Standard descriptive statistics were used to summarise the data,
including absolute and relative frequencies for categorical variables
and median plus the 5th–95th percentile for continuous non-normal
variables; the mean was used as a supplementary descriptive statistic for
the number of pads used per day. We used nonparametric tests, as the
data were not normally distributed. Statistical significance was tested
using the Fisher exact test for categorical variables and the Mann-
Whitney U test for continuous variables. The statistical significance of
time-related differences was computed using the Wilcoxon paired test.
Two definitions of continence were used as endpoints: ICIQ-SF
score 6 and 0 pads used per day. Both endpoints were coded as a binary
dependent variable at a time point of 8 wk, and both were entered into
logistic regression models. The univariate model for patient character-
istics including type of operation and models for patient characteristics
adjusted for type of operation were computed and described using an
odds ratio (OR) and corresponding 95% confidence interval (CI).
The analyses were carried out using SPSS 22 (IBM Corp., Armonk,
NY, USA).
3.
Results
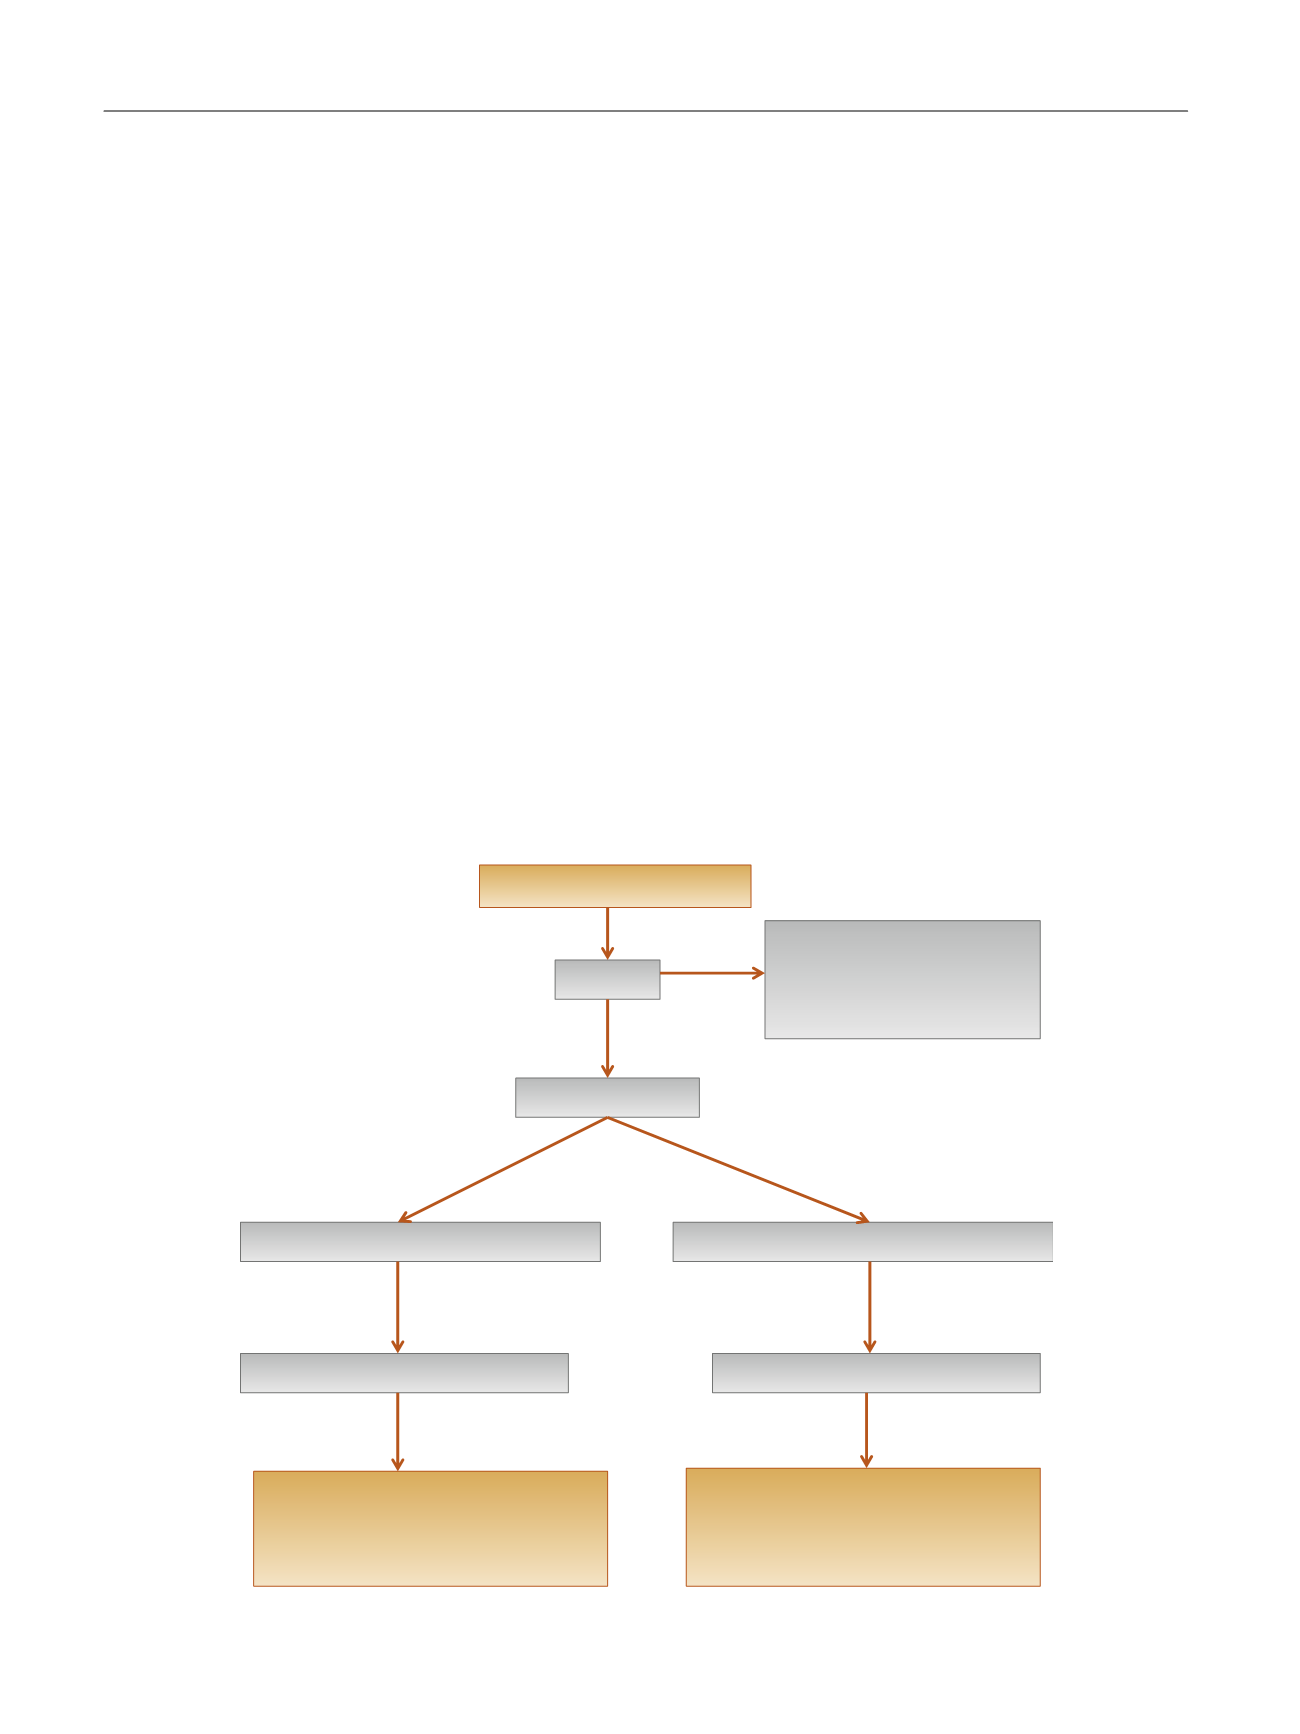
Of the 66 patients, 61 completed the study (12 mo). In the
12-mo period after surgery, continence data were not
collected from five patients because of noncompliance. The
study flow chart is shown in
Fig. 4 .In terms of demographic and clinical data, there were no
significant differences between the groups
( Table 1 ). There
were no perioperative complications. The median operating
time for the new technique was comparable to the control:
78.0 min in the ARVUS group compared to 76.5 min in the
control group. In the postoperative period, there were no
incidences of urinary retention after removal of the urinary
catheter, no anastomosis leaks (no cystography was
performed), and no perineal pain was recorded. There were
four postoperative complications. Three cases involved a
haematoma not requiring drainage (Clavien grade 1–2) and
there was one case of lymphocele that required percutane-
ous drainage (Clavien grade 3). NS procedures were
performed in 28 patient (82.3%) in the control group and
26 (81.2%) in the ARVUS group
( Table 1). There were no
significant differences in oncologic outcome between the
groups. The numbers of patients with pT2 stages, positive
surgical margins, and Gleason score for the final samples
were comparable
( Table 1 ). In both groups, no biochemical
recurrence requiring adjuvant treatment was observed for
[(Fig._4)TD$FIG]
Assessed for eligibility (
n
= 68)
Enrolment
Excluded (
n
= 2)
•
Did not meet the criteria (
n
= 1)
•
Refused to participate (
n
= 1)
Randomised (
n
= 66)
Assigned to standard reconstruction (
n
= 34)
Assigned to ARVUS reconstruction (
n
= 32)
Lost to follow-up at 12 mo (
n
= 3)
Lost to follow-up at 12 mo (
n
= 2)
Analysed at 24 h and 2, 4, and 8 wk (
n
= 34)
Analysed at 6 mo (
n
= 34)
Analysed at 12 mo (
n
= 31)
Analysed at 24 h and 2, 4, and 8 wk (
n
= 32)
Analysed at 6 mo (
n
= 32)
Analysed at 12 mo (
n
= 30)
Fig. 4 – Study flow diagram.
E U R O P E A N U R O L O G Y 7 1 ( 2 0 1 7 ) 8 2 2 – 8 3 0
826