


 706 844

popular risk grouping systems that enjoy relative ease of
use. Although numerous multivariable nomograms derived
from complex regression procedures have been reported,
these have been slow to reach widespread use at least in
part due to their reliance on handwritten or software
calculators. The Cancer of the Prostate Risk Assessment
(CAPRA) score was published in 2005
[1]in an effort to
combine the superior risk prediction of a multivariable risk
stratification tool with a score that can be calculated easily
at the point of care using only simple arithmetic. Ten years
after its initial reporting, we aimed to review the concept,
supporting validation studies, and broader impact of
the CAPRA score including later companion scores for the
postprostatectomy (CAPRA-S) and Japanese primary andro-
gen-deprivation therapy (ADT) settings (J-CAPRA).
To this end, we performed a PubMed/Medline search to
examine all publications addressing the CAPRA and
derivative CAPRA-S and J-CAPRA scores that identified
21 English-language studies. Our primary objective was to
describe the supporting validation studies addressing
clinical performance including the prediction of pathologic
outcomes, clinical recurrence after treatment, distant
metastasis, and prostate cancer–specific survival (PCSM).
2.
CAPRA score
The CAPRA score was based on an initial cohort consisting of
>
1400 men from the University of California, San Francisco
(UCSF) Cancer of the Prostate Strategic Urologic Research
Endeavor (CaPSURE) community-based database from
40 US sites with longitudinal follow-up between
1992 and 2001. These men received radical prostatectomy
without neoadjuvant or adjuvant radiation therapy or
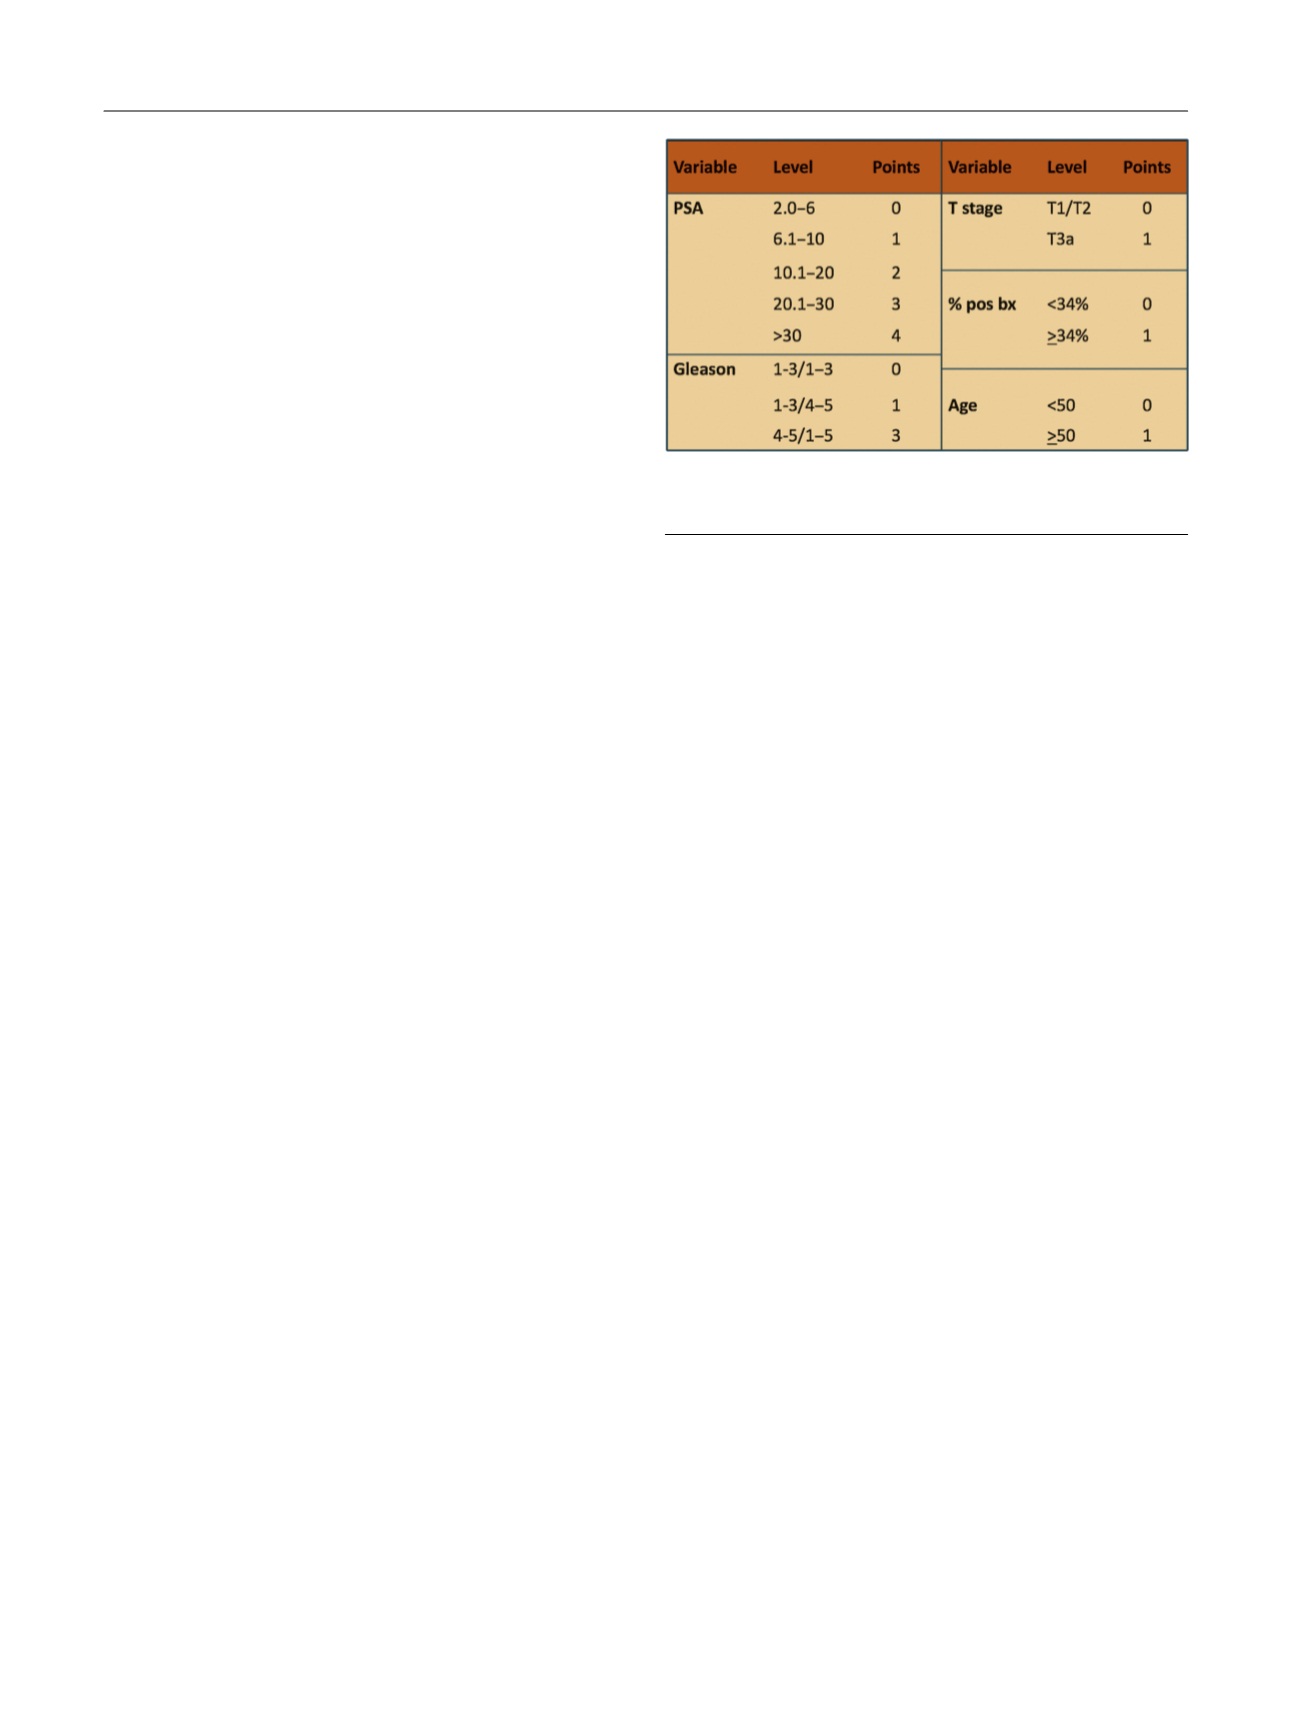
hormonal therapy. A Cox proportional hazards regression
model identified age, pretreatment PSA, Gleason score,
percentage of biopsy cores positive for cancer, and clinical
stage as significant factors associated with biochemical
recurrence (BCR) or secondary treatment
( Fig. 1). Race was
determined not to be a significant predictor and was not
included in the final model. CAPRA score points were
determined based on the parameter estimates in the
resulting model: a sum of up to 4 points for categorized
PSA, up to 3 points for Gleason score, and 1 point each for
percentage of biopsy cores, clinical stage, and age. In the
resulting 0–10 score, every 2-point increase in the score
represents an approximate doubling of risk. For simplicity,
the CAPRA score can be categorized so 0–2 indicates low
risk; 3–5, intermediate risk; and 6–10, high risk
[2] .The
CAPRA score is intended to indicate
relative
rather than
absolute
risk.
Following its initial publication in 2005, multiple
external independent validations of the CAPRA score have
been performed to date in larger international populations,
academic, and Veteran Affairs centers
( Table 1 ). The CAPRA
score has been validated to predict pathologic stage, as well
as significant oncologic end points including metastatic
progression and PCSM following treatment
[24]. The CAPRA
score also is one of the only risk stratification systems to
have been validated successfully following prostatectomy,
radiation therapy, hormonal therapy, and other manage-
ment approaches
[3,7,12,14,15] .Only a subset of validation
studies directly compared the CAPRA score with the
D’Amico classification or nomograms. These studies all
demonstrated that in terms of discrimination, the CAPRA
score is superior to the D’Amico classification and similar to
the nomograms; in terms of calibration, most but not all
showed better calibration for the CAPRA score than for the
nomograms
[3,6,8,9].
3.
CAPRA-S score
Based on preoperative PSA and pathologic parameters
determined at the time of surgery, the CAPRA-S score was
developed to provide clinicians additional information to
help predict disease recurrence including BCR, systemic
progression, and PCSM
[25]. Preoperative PSA (0–6, 6.01–10,
10.1–20, and
>
20), pathologic Gleason score (2–6, 3 + 4,
4 + 3, and 8-10), as well as the presence or absence of seminal
vesicle invasion (pT3b), positive surgical margins, extra-
capsular extension (pT3a), or lymph node positivity were
entered into a multivariate Cox proportional hazards model.
The scoring point values were derived from the log hazard
ratio parameter estimates
( Fig. 2 ). The CAPRA-S score has
subsequently been validated in US and international
populations and evaluated as a predictor of downstream
oncologic end points including BCR and systemic progres-
sion
( Table 1 ).
4.
J-CAPRA score
For men presenting initially with locally advanced and/or
metastatic PCa, standard risk stratification schemata do not
apply. To develop a risk stratification system for these men,
who are usually treated initially with primary ADT, the
J-CAPRA score was developed using data from the US
CaPSURE database and the J-CaP registry, a national PCa
registry in Japan that includes a relatively high proportion of
patients treated with primary ADT
[26]. The J-CAPRA score
offers a risk estimation for progression-free survival (PFS)
[(Fig._1)TD$FIG]
Fig. 1 – CAPRA score.
pos bx = positive biopsy; PSA = prostate-specific antigen.
E U R O P E A N U R O L O G Y 7 1 ( 2 0 1 7 ) 7 0 5 – 7 0 9
706