


 703 844

prediction of ECE, SVI, and nodal disease included age, PSA,
clinical stage, primary Gleason score 4 or 5, and percentage
of involved cores/total cores. All of these, except for age and
PSA, were significant predictors of outcome, with primary
Gleason 4 or 5 being the strongest factor associated with
each outcome (odds ratio [OR] 2.3,
p
<
0.01 for ECE; OR 5.7,
p
<
0.0001 for SVI; OR 7.147,
p
<
0.01 for N+ disease). When
MRI results were added to each model, they showed a
significant association with the outcomes (all
p
<
0.001).
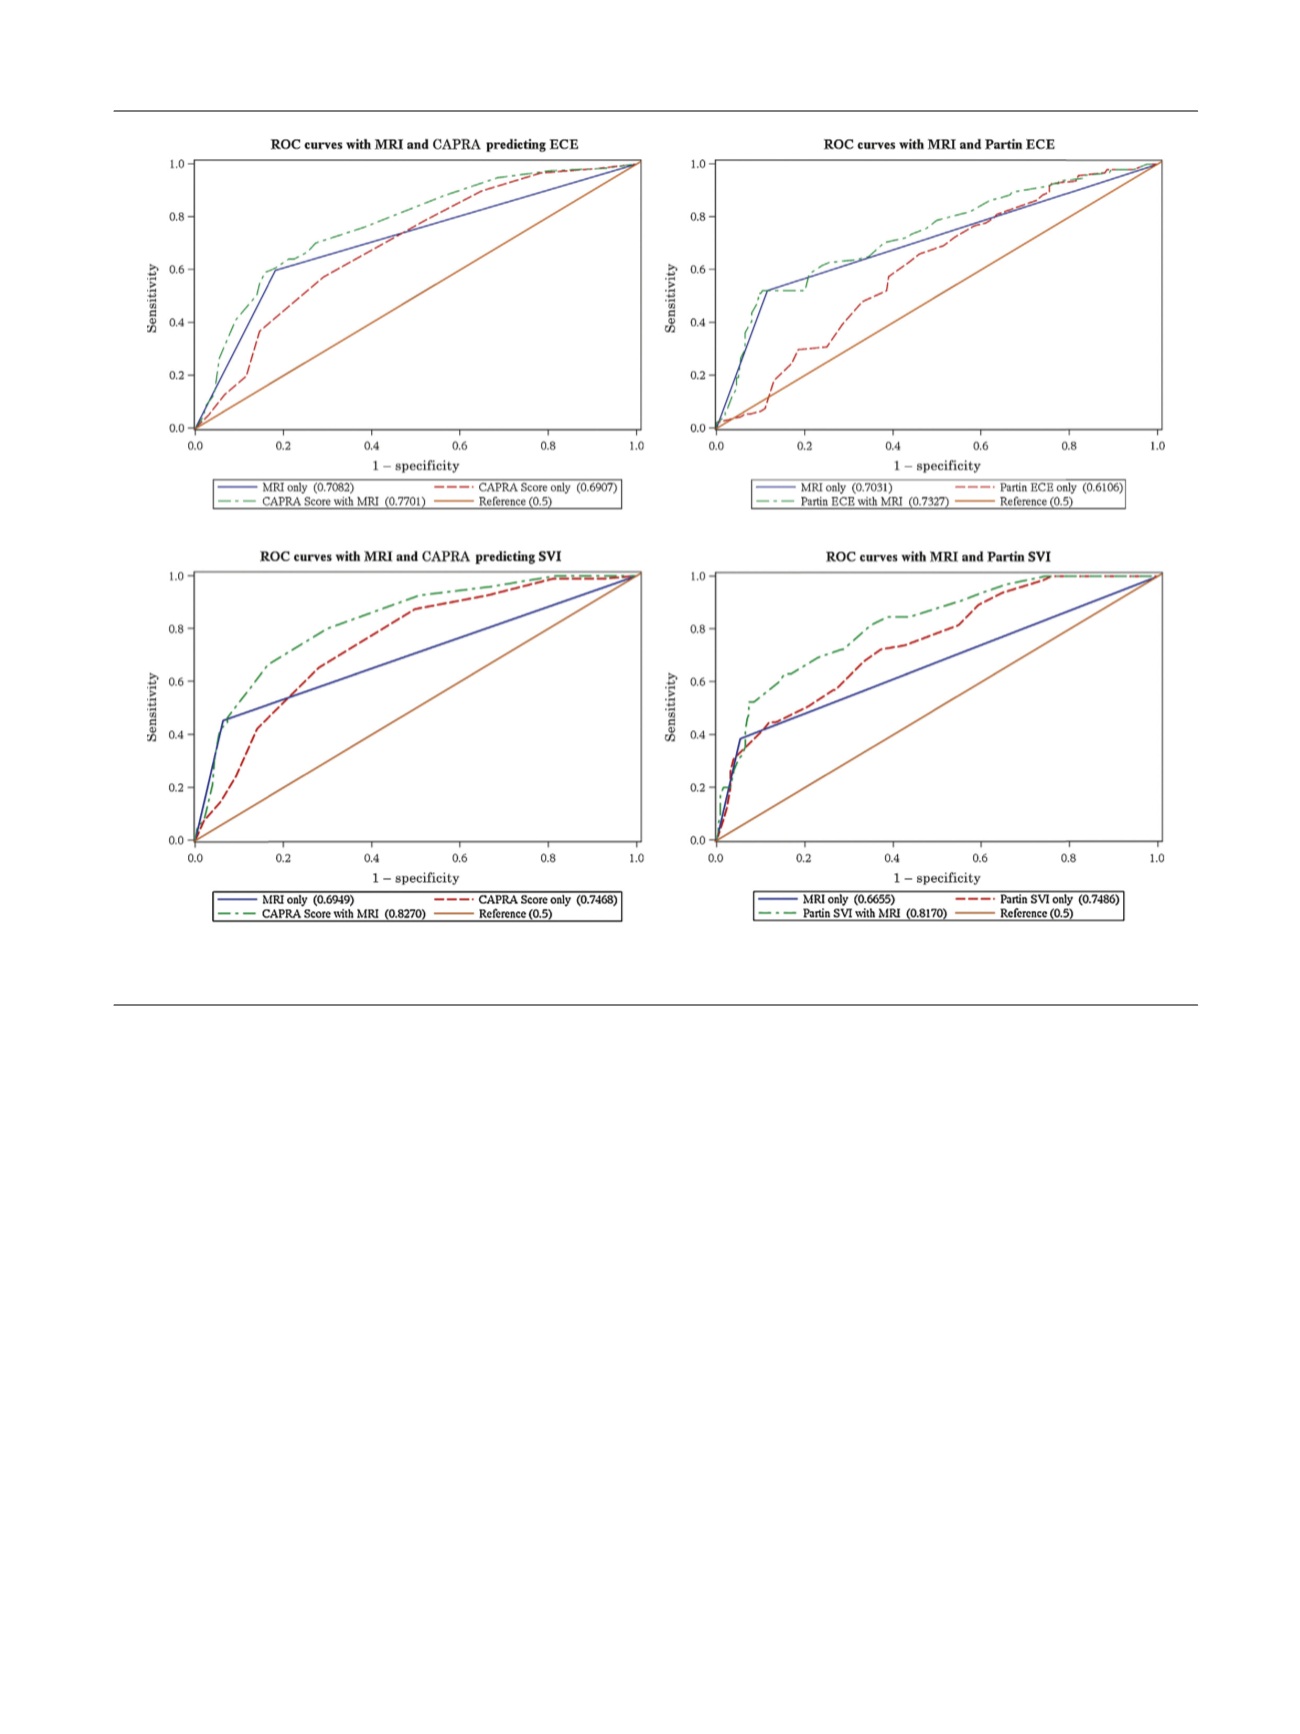
Combined MRI and each model outperformed individual
models alone at all levels in the receiver-operating
characteristic analysis (Supplementary Table 2). Comparing
Partin and Partin + MRI predictive models, the AUC was
0.61 versus 0.73 for ECE, 0.75 versus 0.82 for SVI
( Fig. 1), and
0.82 versus 0.85 for N+ (Supplementary Fig. 1). Comparing
CAPRA and CAPRA + MRI models, the AUC was 0.69 versus
0.77 for ECE, 0.75 versus 0.83 for SVI
( Fig. 1 ), 0.82 versus
0.85 for N+ (Supplementary Fig. 1).
Our results suggest that MRI information can provide an
added value when compared with clinical-based, Partin
Table, or CAPRA score models alone for the prediction of
adverse histopathological outcomes at RP. Based on our
data and on the nature of our cohort, patients with doubtful
clinical findings and intermediate to high risk disease could
benefit the most from preoperative MRI. Few studies have
explored the potential additional value of MRI, and those
that have are relatively underpowered. Feng et al
[6]compared the predictive accuracy of MRI and clinical
models (Partin Tables and Memorial Sloan Kettering Cancer
Center nomogram) for ECE finding a minor improvement in
diagnostic accuracy after addition of MRI to the model (AUC
for Partin Tables and Memorial Sloan Kettering Cancer
Center of 0.85 and 0.86, respectively, increased to 0.93 and
0.94 after addition of MRI). The magnitude of the difference
they detected is likely lower than ours because they had a
lower risk cohort and thus had lower rates of ECE, which
would falsely inflate the AUC for models that predicted
against ECE and underestimate the utility of an MRI. For
instance, 95% of their cohort was either cT1c or cT2a, while
only 66% of our core met these criteria.
Gupta et al
[7]compared the accuracy of 3-Tesla MRI and
Partin Tables in predicting ECE. This study did not analyze
the additional value of MRI to the Partin Tables, but rather
compared those two tools in alternative models, finding a
Partin accuracy similar to ours (AUC: 0.62) and a MRI AUC of
0.82. Again, however, the study population was small
(60 patients) and with a clear preponderance of clinically
low and intermediate-risk patients. Tay et al
[8]used 3-Tesla
[(Fig._1)TD$FIG]
Fig. 1 – receiver operating characteristic (ROC) curves for extracapsular extension (ECE) and seminal vesicle invasion (SVI) prediction.
CAPRA = Cancer of the Prostate Risk Assessment; MRI = magnetic resonance imaging.
E U R O P E A N U R O L O G Y 7 1 ( 2 0 1 7 ) 7 0 1 – 7 0 4
703