


 783 844

staining of tumor cells was associated with higher GS and
the presence of metastases at diagnosis (Supplementary
Table 1). In addition, when patients with metastases (M1)
at diagnosis were excluded from the analysis, patients with
low (negative to weak) HLA ABC immunoreactivity had
shorter cancer-specific survival than patients with moder-
ate to intense immunoreactivity
( Fig. 5B;
p
= 0.047,
n
= 248). In patients managed with watchful waiting
(
n
= 202), a similar but nonsignificant trend was seen
( Fig. 5 C;
p
= 0.13).
4.
Discussion
We found two subgroups among CRPC bone metastases,
defined by high AR activity and low cellular immune
responses, or low AR activity and high cellular immune
responses. Moreover, CRPC bone metastases with high AR
activity seemed to have higher metabolic activities than
metastases with low AR activity. To the best of our
knowledge, these two CRPC subgroups have not previously
been described. Our results confirm previous findings of
lower levels of PSMB9, TAP1, and HLA class 1 molecules in
PC compared to benign prostate tissue
[9–11]. Importantly,
we also present novel data indicating an association
between low tumor HLA class I ABC immunoreactivity at
diagnosis and poor clinical outcome, as well as markedly
lower HLA class I expression in PC bone metastases
compared to primary tumors.
The subgroups observed had similar expression levels
of neuroendocrine and cancer stem-cell markers
(Supplementary Table 2), and we found no enrichment of
tumors negative for MHC class I among docetaxel-treated
[(Fig._4)TD$FIG]
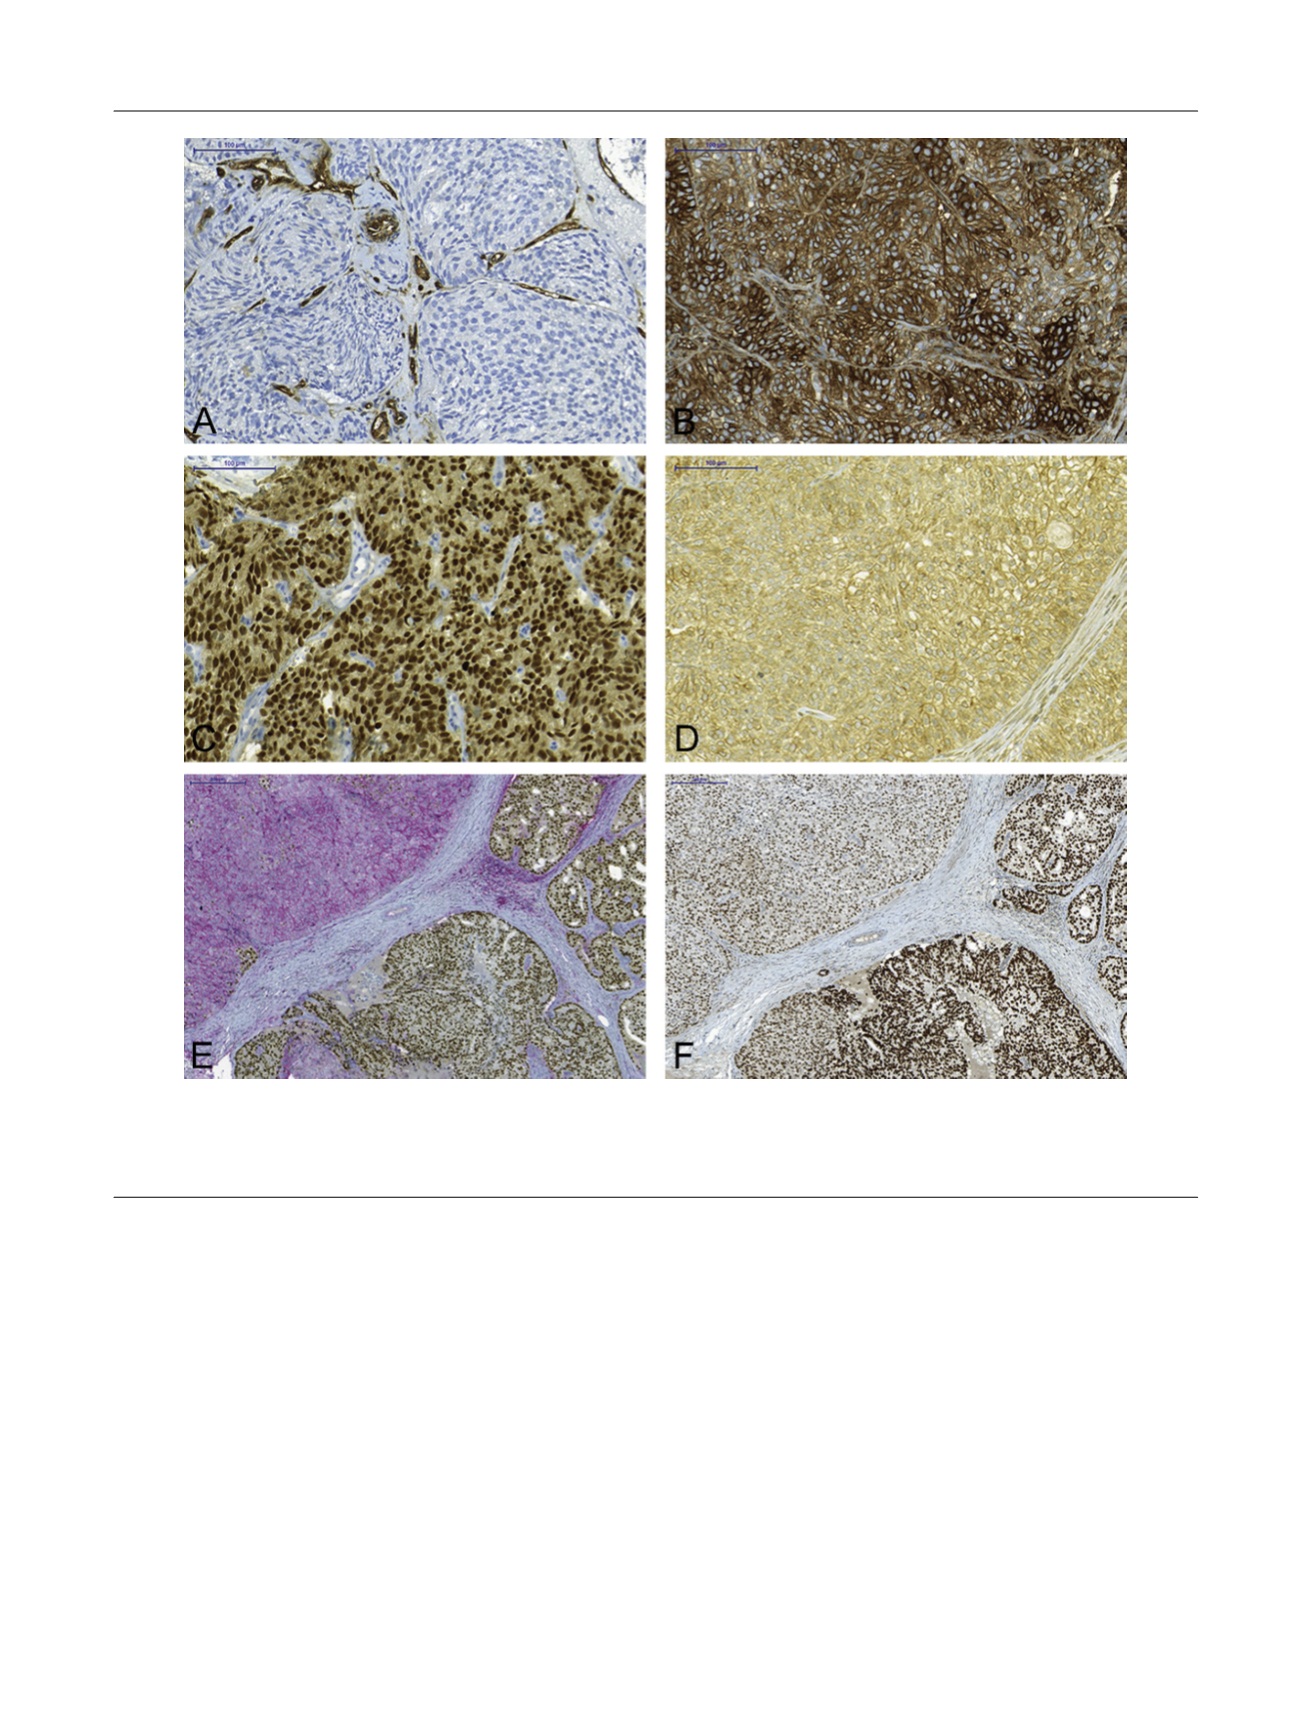
Fig. 4 – Immunohistochemistry for (A,B) HLA class I ABC and (C,D) androgen receptor (AR) in bone metastasis tissue sections from patients with
castration-resistant prostate cancer (CRPC). One patient exhibits negative HLA class I staining (A) and intense nuclear AR staining (C) while the other
exhibits intense HLA class I staining (B) and negative nuclear AR staining. (E) Double staining for HLA class I ABC (red) and AR (brown) in CRPC
metastasis and (F) immunohistochemistry for FOXA1 in a parallel metastasis section. Magnification according to scale bars in the figure.
E U R O P E A N U R O L O G Y 7 1 ( 2 0 1 7 ) 7 7 6 – 7 8 7
783