


 780 844

Ingenuity Pathway Analysis tool for assignment of altered
canonical pathways and identification of upstream regulators.
According to analysis of 617 upregulated and 906 down-
regulated gene transcripts, AR-driven CRPC metastases had
higher metabolic activity for biosynthesis of cholesterol,
pyrimidines, and spermine and degradation of fatty acids
and amino acids when compared to non–AR-driven samples
( Table 2 ). Among the downregulated canonical pathways in AR-
driven metastases, the cellular immune response was the most
obvious
( Table 2 ). Upstreamregulators predicted as responsible
for the differential expression observed between AR-driven and
non–AR-driven CRPC bone metastases are listed in Supple-
mentary Table 4.
AR
,
SPDEF
, and
FOXA1
were among the top
activated genes that also showed increased mRNA levels in AR-
driven metastases, while several immune regulating genes
such as
TGFB1
,
INFG
, and other cytokines were predicted to be
inhibited, and some (
CCL5
,
ETV5
,
PLAUR
, and
IFNAR2
) also
showed reduced mRNA levels (Supplementary Table 4).
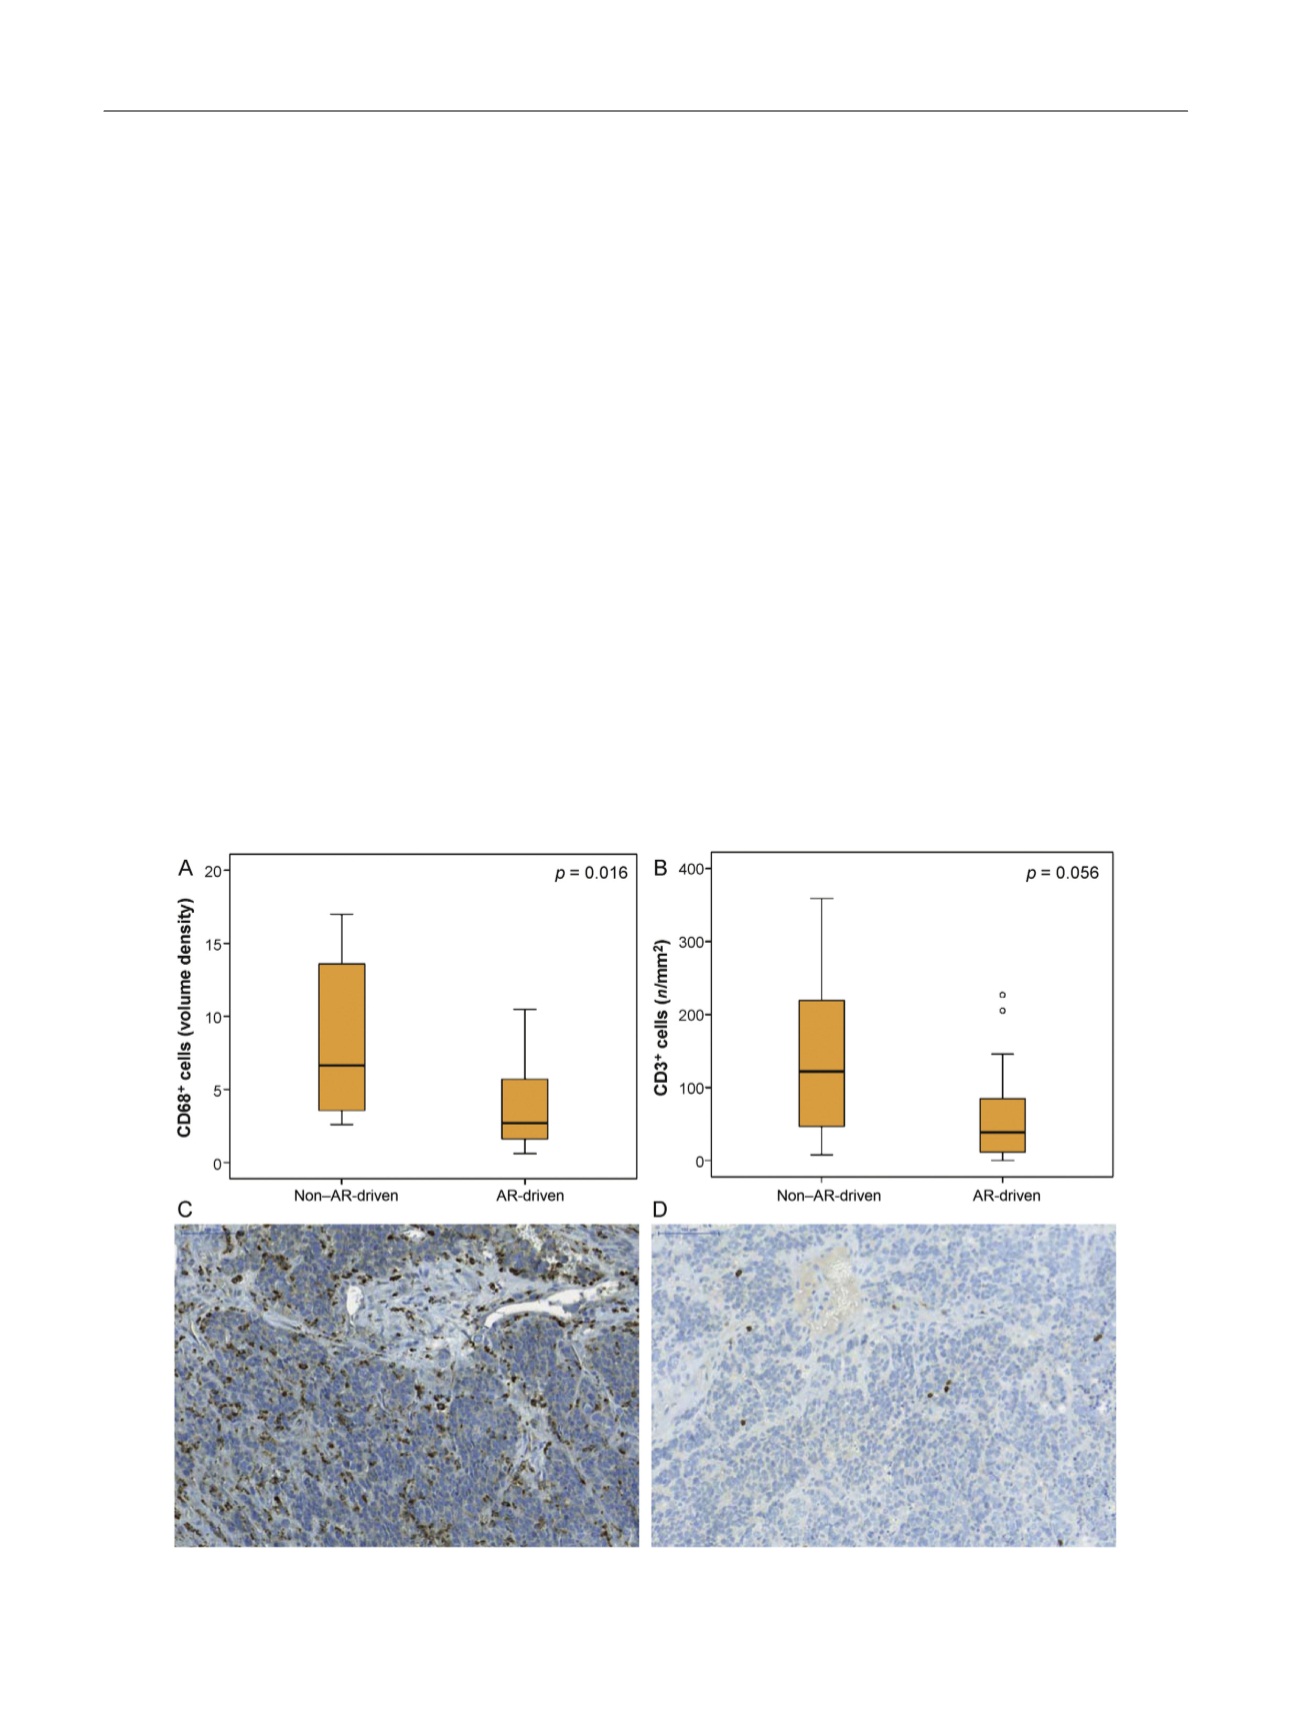
The predicted difference in cellular immune response
was verified by immunohistochemical analysis of CD3
+
[3_TD$DIFF]
and CD68
+
cells in CRPC bone metastases in FFPE
tissue available, which revealed a significantly higher
volume density of CD68
+
[5_TD$DIFF]
monocytes and borderline higher
frequency of CD3
+
infiltrating lymphocytes in non–
AR-driven compared to AR-driven bone metastases
( Figure 2A–D). Gene expression data indicated higher
levels of CD3
+
T cells, and specifically of CD8
+
effector
T cells and CD4
+
helper T cells in non–AR-driven compared
to AR-driven metastases (Supplementary Fig. 1A–C). This
was accompanied by increased levels of the inhibitory T
cell receptors CTLA4 and PDCD1 and lower levels of the
proinflammatory Th1 transcription factor TBX21 (Supple-
mentary Fig. 1D–F), while levels of the stimulatory T-cell
receptors ICOS and CD28 and the anti-inflammatory
Th2 transcription factor GATA did not differ between
non–AR-driven and AR-driven metastases (data not
shown). We did not detect mRNA for the regulatory T
cell (Treg) transcription factor FOXP3. Non–AR-driven
cases had higher levels of
CD68
,
CD163
, and
S100A9
mRNA
(Supplementary Fig. 1G–I) but not
NOS2
mRNA (data not
shown), indicating metastasis infiltration of tumor-pro-
moting M2 macrophages and myeloid-derived suppressor
cells (MDSCs).
The downregulated antigen presentation observed in
AR-driven CRPC bone metastases (Table 2 and Supplemen-
tary Fig. 2) possibly contributed to the low immune-cell
infiltration, and this pathway was therefore selected for
further examination.
3.3.
Downregulation of MHC class I expression during PC
progression
To verify the PCA findings, we analyzed the expression
levels of genes involved in MHC class I antigen processing
[(Fig._2)TD$FIG]
Fig. 2 – Immunohistochemical analysis demonstrating (A) significantly higher infiltration of CD68
+
immune cells and (B) borderline higher infiltration
of CD3
+
immune cells in non–AR-driven (
n
= 8) compared to AR-driven (
n
= 26) castration-resistant prostate cancer bone metastases. Sections show
representative (C) CD68 and (D) CD3 staining of a non–AR-driven metastasis sample.
E U R O P E A N U R O L O G Y 7 1 ( 2 0 1 7 ) 7 7 6 – 7 8 7
780