


 779 844

ultraView Universal DAB detection kit with the CC1 antigen retrieval
technique on an automatic Ventana Benchmark Ultra system according
to the manufacturer’s protocol (Roche Diagnostics, Basel, Switzerland),
with primary antibodies for CD3 (1:50, NCL-L-CD3-565; Novocastra,
Newcastle upon Tyne, UK), CD68 (1:2000, M0814; Dako, Glostrup,
Denmark), HLA class I ABC (1:200, ab70328; Abcam, Cambridge, UK), and
FOXA1 (1:200, ab23738; Abcam). The AR was detected after antigen
retrieval in Tris/EDTA (pH 9) with anti-AR (1:150, MUC256-UCE;
Biogenex, Fremont, CA, USA) and an IPflx system (Biocare Medical,
Concord, CA, USA) using a Mach3 mouse kit with DAB as chromogen. For
double staining, HLA ABC was detected with Ap RED as chromogen
following AR detection after incubation of sections for 5 min in
denaturation buffer (DNS001H; Biocare Medical). The volume density
of CD68
+
cells was determined using a square lattice mounted in the
eyepiece of a light microscope and counting cross-sections falling on
stained cells or reference tissue, and expressed as the average density per
tissue after evaluation of at least ten randomly selected fields.
Metastasis-infiltrating CD3
+
cells were less abundant than CD68
+
cells
and were therefore evaluated as the number of positive cells in the total
stained tumor area using a Pannoramic 250 FLASH scanner and
Pannoramic viewer 1.15.2 software (3DHISTECH, Budapest, Hungary).
HLA class I ABC staining intensity was scored as negative (0), weak (1),
moderate (2), or intense (3), and the most common score per sample/
TMA core was recorded. For survival analysis, each patient was
represented by the less stained TMA core (median and maximum
intensities were evaluated, with similar results; data not shown).
Nuclear AR immunoreactivity in tumor cells was scored according to
intensity (0 = negative, 1 = weak, 2 = moderate, 3 = intense staining) and
fraction of cells stained (1 = 1–25%, 2 = 26–50%, 3 = 51–75%, 4 = 76–
100%). A total score (ranging from 0 to 12) was obtained by multiplying
the staining intensity and fraction scores, as previously described
[6]. When comparing immunoreactivity between two groups, the Mann-
Whitney
U
-test and
x
2
test were used for continuous and categorical
variables, respectively. Survival analysis was performed using the
Kaplan-Meier method, with death from PC as events and death from
other causes as censored events. Correlations between variables were
analyzed using the Spearman rank test.
3.
Results
3.1.
Whole-genome expression analysis identifies CRPC
subgroups according to AR activity
A set of fresh-frozen bone metastases from CRPC patients
(
n
= 40) was characterized and compared to bonemetastases
from eight untreated PC patients and 12 untreated male
patients with other primary malignancies using whole-
genome expression profiling and multivariate PCA. The PCA
model resulting from analysis of 21 675 gene probe signals
included nine significant principal components explaining
45% of the total variation in the expression data. The first
component describing the largest variation in the data
(R2X=11%, Q2=7%), and thus the most prominent subgroups,
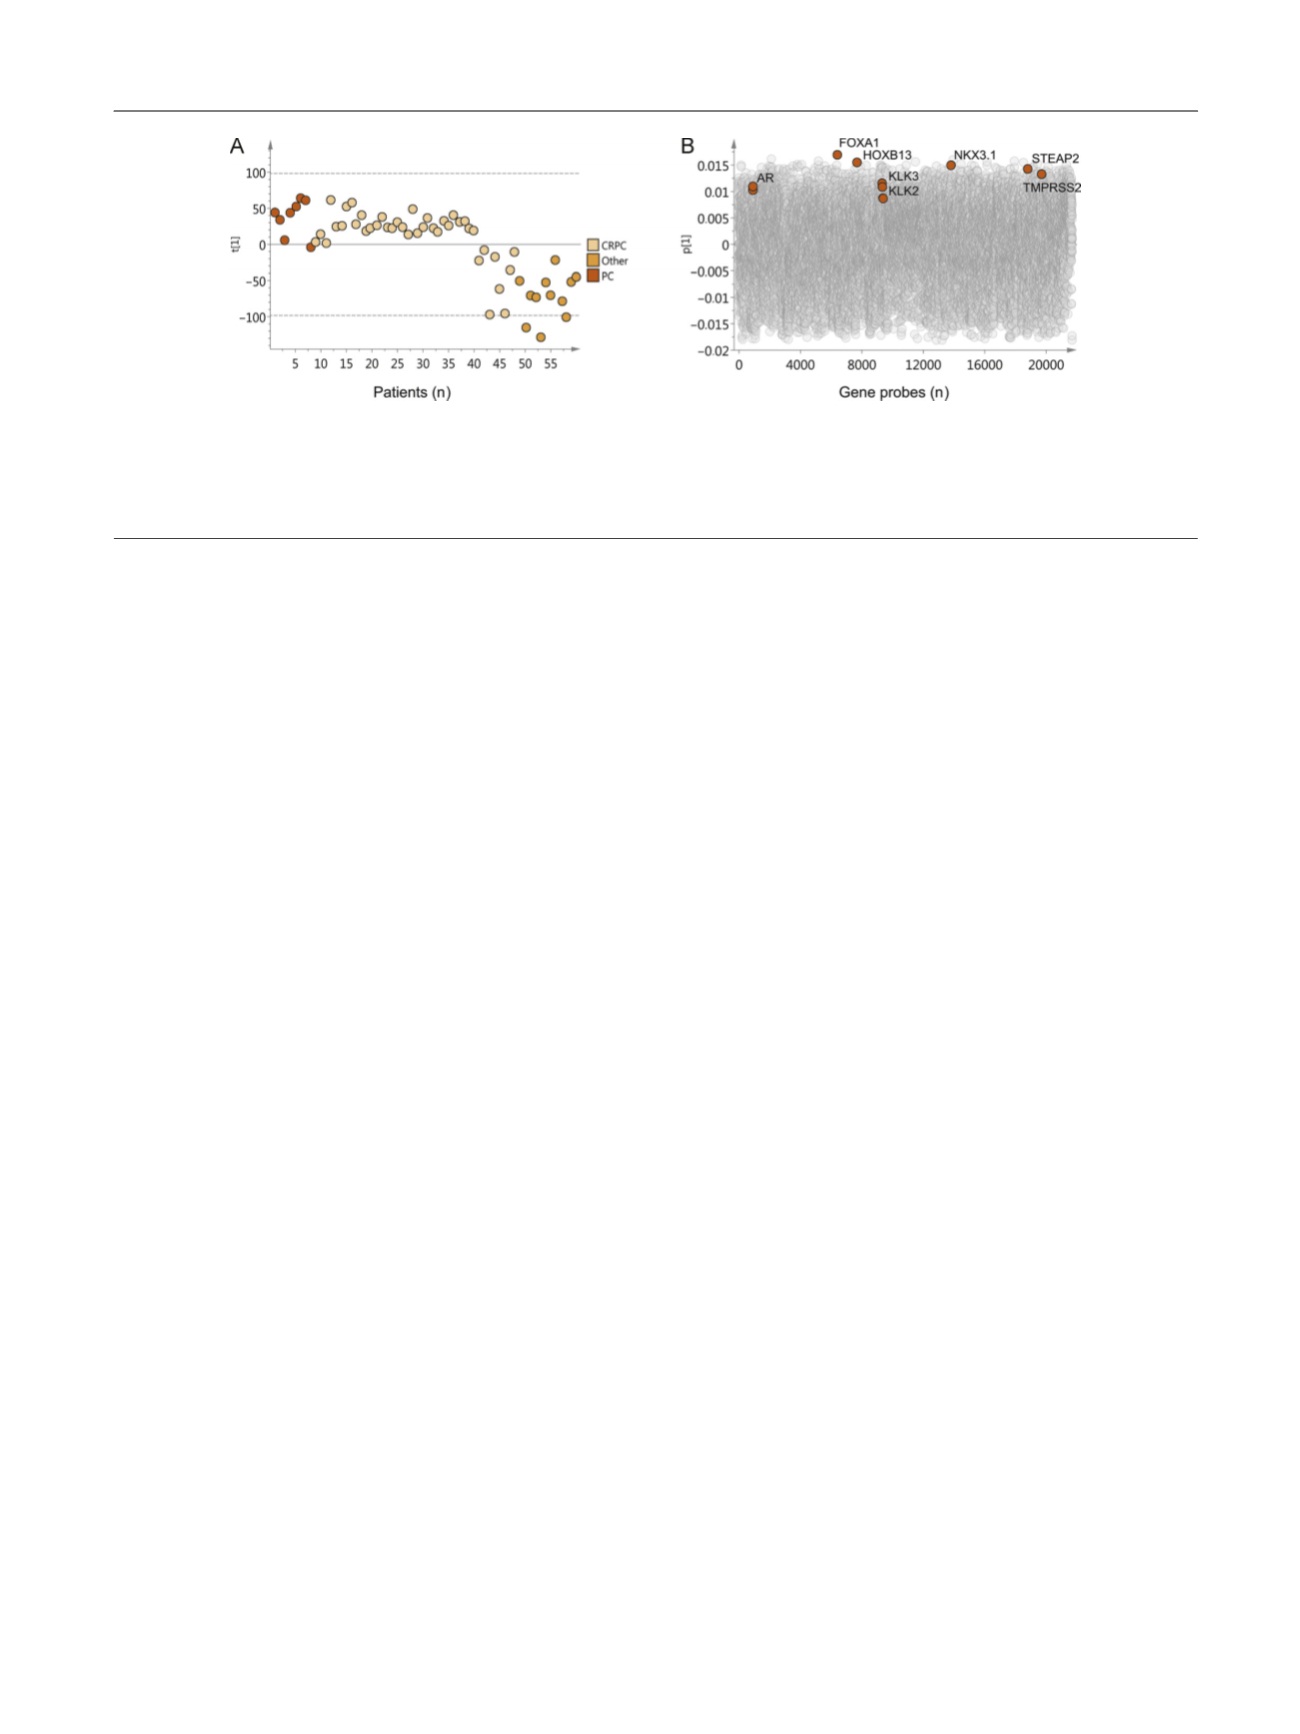
was selected for further investigation. It is evident in
Figure 1A that the majority of the CRPC bone metastasis
samples cluster close to the untreated PC metastases, while
some CRPC samples cluster closer to metastases of other
malignancies. According to the score values for the first
principal component
t
1 in
Figure 1 A, the CRPC samples were
divided into two groups; samples with positive scores
showing high transcript levels of the AR, the AR co-
regulators FOXA1 and HOXB13, and androgen-regulated
genes such as
KLK2
,
KLK3
,
NKX3.1
,
STEAP2
, and
TMPRSS2
; and
samples with negative scores showing low levels of these
gene transcripts
( Fig. 1 B). Univariate analysis of differentially
expressed genes identified the AR and many AR-regulating
and/or AR-regulated gene transcripts among the top genes
with positive fold changes in samples with positive
compared to negative PCA scores (Supplementary
Table 2). On the basis of these findings, the 32 CRPC samples
with positive PCA scores (80%) were defined as AR-driven
and the eight CRPC samples with negative PCA scores (20%)
as non–AR-driven. Notably, patients with AR-driven CRPC
metastases had higher serum PSA levels than patients
with non–AR-driven metastases at the time of metastasis
surgery (and borderline higher PSA at diagnosis). No obvious
association with previous treatments, presence of soft
tissue metastasis, or cancer-specific survival after metastasis
surgery
[4_TD$DIFF]
was found (Supplementary Table 3).
3.2.
Functional differences between AR-driven and non–AR-
driven CRPC bone metastases
To examine functional differences between AR-driven and
non–AR-driven CRPC samples, the list of differently
expressed genes (fold change
1.5 and p P 0.01,
Supplementary Table 2) was imported into the Qiagen
[(Fig._1)TD$FIG]
Fig. 1 – Principal component analysis of 2 1675 assigned gene products in 60 bone metastases samples. (A) Score plot for the first principal component
.
Each dot corresponds to one metastasis sample collected from untreated prostate cancer (PC) patients (
[6_TD$DIFF]
orange), castration-resistant prostate cancer
(CRPC) patients (
[7_TD$DIFF]
beige), and patients with other malignancies (
[8_TD$DIFF]
yellow). Samples cluster according to their relative gene expression. (B) Loading plot
showing gene probes responsible for the clustering of samples. Gene probes with positive loading values (p) are expressed at high levels in samples
with positive score values (t) and vice versa. Black circles denote the gene probes for AR, FOXA1, HOXB13, KLK3, KLK2, NKX3.1, STEAP2, and TMPRSS2.
E U R O P E A N U R O L O G Y 7 1 ( 2 0 1 7 ) 7 7 6 – 7 8 7
779