


 842 844

DNA mismatch repair–related
MSH2
gene in P5U2. Hence,
in this case, two mutagenic
[7_TD$DIFF]
fuels — AA exposure and a
DNA mismatch repair defect — jointly drive mutagenesis
and carcinogenesis.
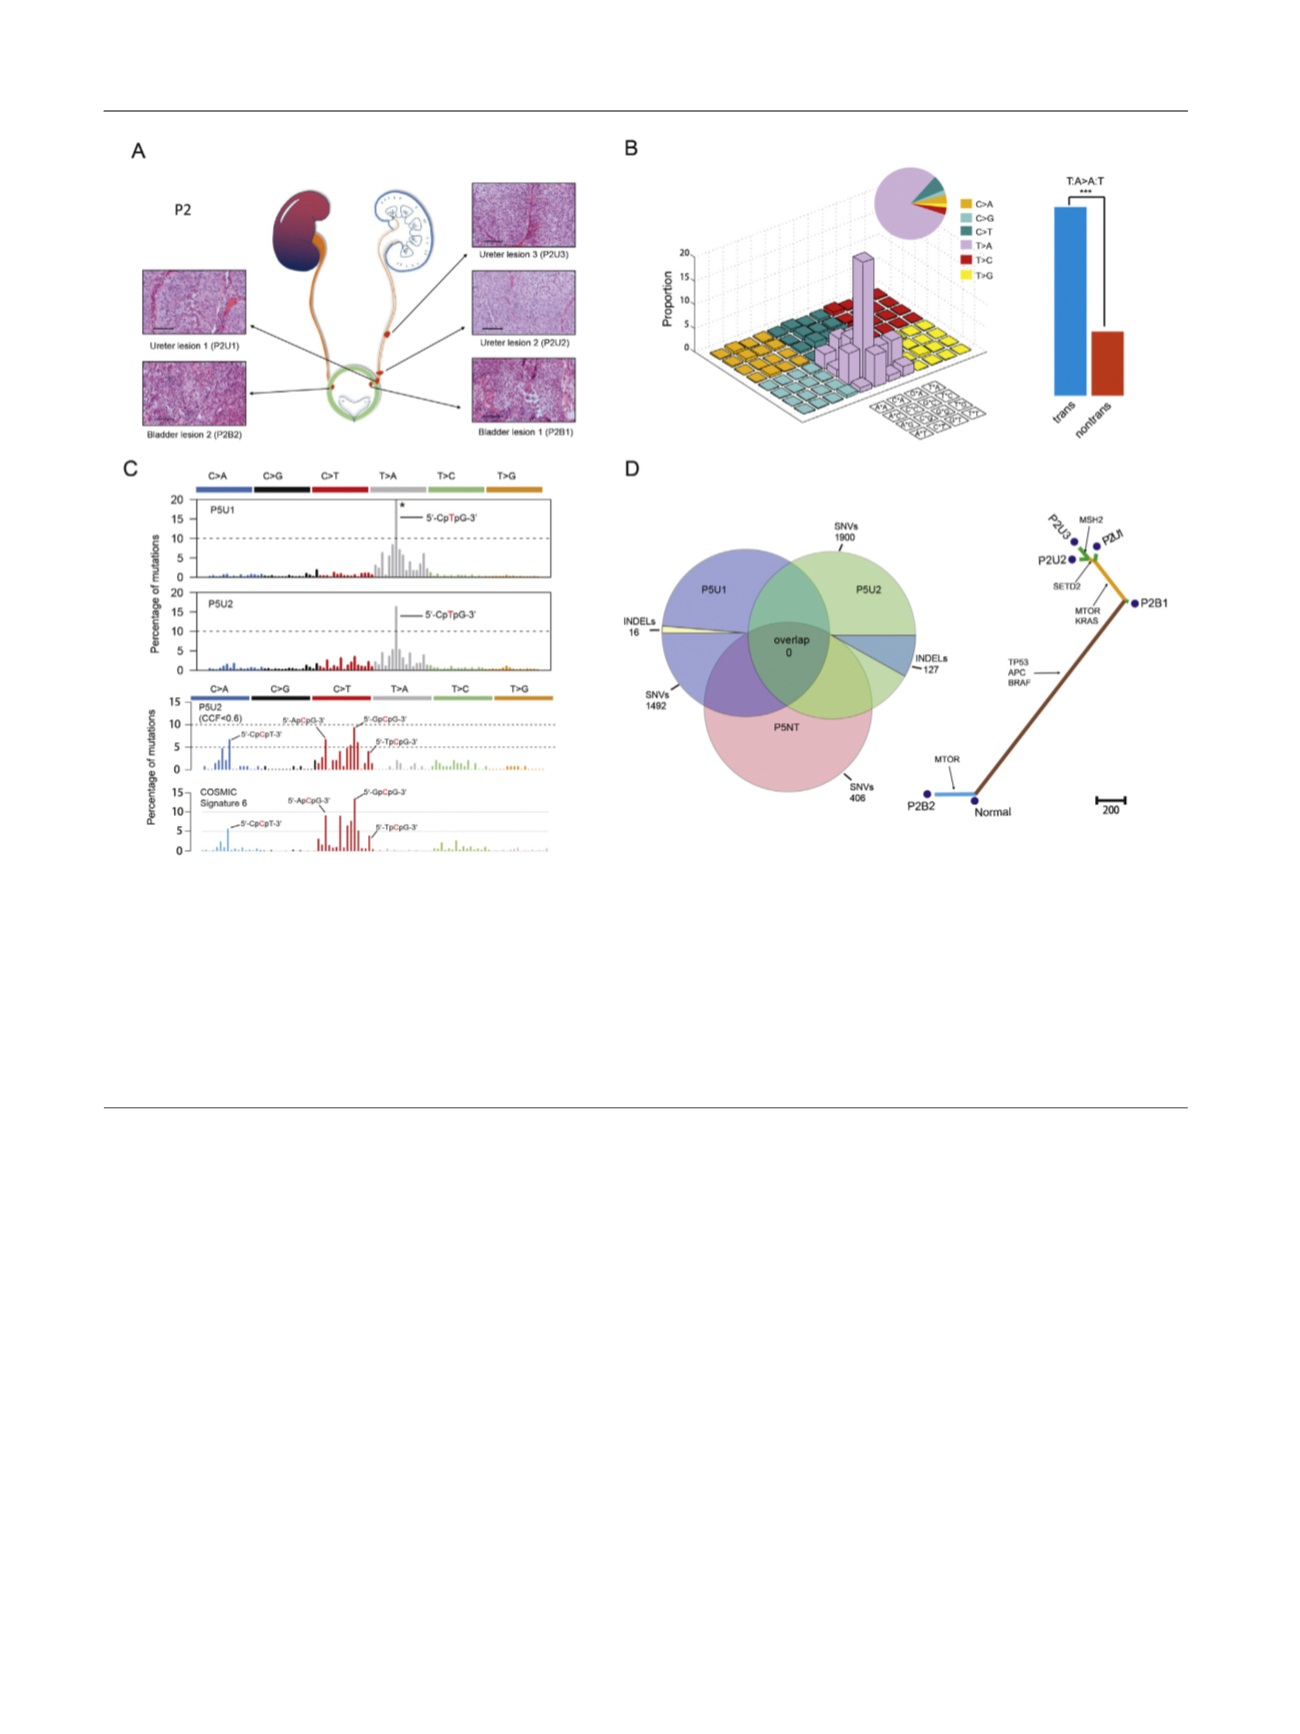
We also investigated the clonal relationship of different
tumors in each patient. Three specimens from patient 5
(P5U1, P5U2, and P5NT) shared no genetic alterations,
indicating their independent clonal origins (
Fig. 1
D). Similar
observations were made for patients 1 and 3 (Supplemen-
tary Fig. 6). In stark contrast, the two tumors in patient
4 were genetically related, sharing
>
2000 mutations and
exhibiting similar somatic copy number alteration (SCNA)
patterns (Supplementary Fig. 7 and 8). In patient 2, the five
tumors exemplify a scenario in which multiclonal and
monoclonal tumors coexist in the same patient (
Fig. 1
D and
Supplementary Fig. 9).
Recurrent mutated genes and SCNAs in UCC were also
identified in our study
[7]
. For example,
TP53
was
commonly mutated in all the tumors, but the wild type
was observed in sample P5NT. Copy number gains in
chromosomes 1q and 8q and losses in 2q and 8p were
frequently observed among our cohort (Supplementary
Figs. 10 and 11).
Our results highlight AA as a potential risk factor for
multifocal UCC, so more attention should be paid to the
etiological effects of AA.
Sequence data have been deposited in the NCBI Sequence
Read Archive under accession number SRP079792
Conflicts of interest:
The authors have nothing to disclose.
Acknowledgments:
We thank all the patients for their participation in
this study. We thank Zhe Su and Yang Liu at the Biodynamic Optical
Imaging Center (BIOPIC), Peking University; Gongwei Wang at the
Department of Pathology, Peking University People’s Hospital; Xiongjun
Ye at the Department of Urology, Peking University People’s Hospital;
and Caipeng Qin at the Department of Urology, Peking University
International Hospital for useful discussions. This work was supported
by the National High Technology Research and Development Program of
[(Fig._1)TD$FIG]
Fig. 1 – Sample information and exome sequencing. (A) Spatial locations and histologic features (hematoxylin and eosin staining) of five tumors from
patient 2. Red spots show the locations of these tumors in the urinary tract. Scale bar, 100
m
m. Tumor names are in the form of patient identification
+ tumor type. For example, P2U1 represents the first ureter tumor from patient 2. U = ureter tumor; B = bladder tumor. (B) The left panel shows the
mutational signature of all the tumors. The right panel shows the proportion of T
!
A:A
!
T transversion on transcriptional and nontranscriptional
strands. ***
p
< 0.001. (C) The upper panel shows the mutational signature of P5U1 and P5U2. The asterisk indicates that the proportion of certain
mutation subtypes exceeds 20%. The lower panel shows the latent mutational signature deciphered from P5U2 and comparison between this and
mutational signature #6 documented by the Catalog of Somatic Mutations in Cancer. The arrow indicates the trinucleotide motif. The mutated base is
in red
[1_TD$DIFF]
. CCF = cancer cell fraction. (D) In the left panel, a Venn diagram shows the number of somatic mutations in the two tumors and one sample of
normal urothelial tissue from patient 5. SNVs = single-nucleotide variants; INDELs = insertions and deletions. The right panel shows a phylogenetic tree
depicting the clonal relationship of tumors in patient 2. The branch length is proportional to the number of nonsynonymous mutations. Arrows
indicate the potential driver-mutated genes.
E U R O P E A N U R O L O G Y 7 1 ( 2 0 1 7 ) 8 3 7 – 8 4 3
842