


 769 844

adjuvant ADT alone, of which seven had node-positive
(pN+) disease. Of the 28 patients with pN+ disease (16.5%),
seven (25%) had adjuvant ADT and three (10.7%) had
postoperative RT with ADT. Two (0.9%) and one (1.2%) EBRT
and EBRT + BT patients received local salvage therapy
(cryoablation in all cases), while 73 (49.0%) RP patients
not receiving ART received SRT to a median EQD
2
of 68 Gy
(
p
<
0.0001).
Forty-five (19.7%), 14 (16.1%), and 52 (30.1%) EBRT,
EBRT + BT, and RP patients received salvage ADT, respec-
tively (
p
<
0.001). Among RP patients, median time to SRT
was 1.0 yr (0.2–14.4 yr). Time to salvage ADT was 2.9 (0.4–
6.6) yr, 3.2 (0.6–8.2) yr, and 2.4 (0.1–14.6) yr after EBRT,
EBRT + BT, and RP.
3.3.
BCR and DM
Overall outcome frequencies are shown in Supplementary
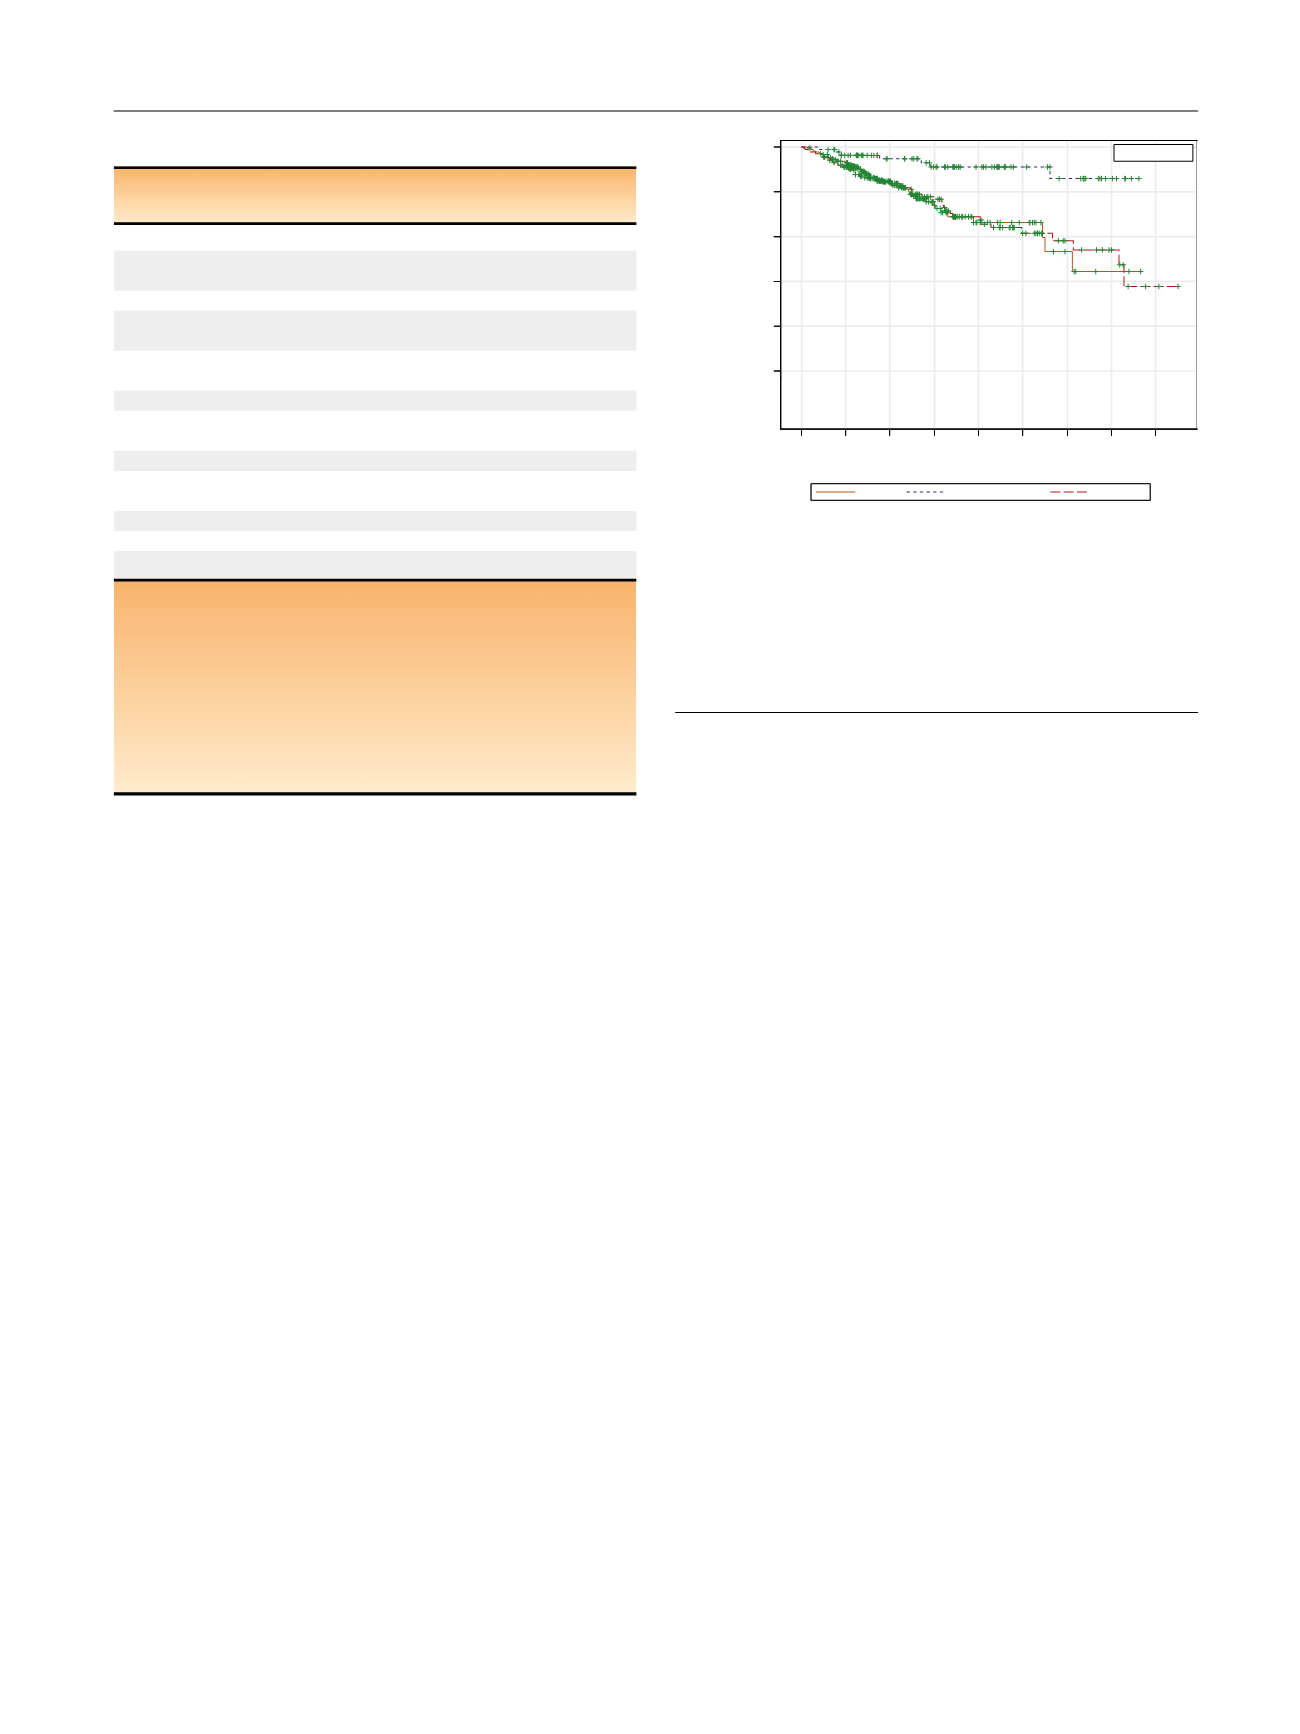
Table 1. Kaplan-Meier curves for DMFS are shown in
Fig. 1,
and results of multivariate Cox regression are shown in
Table 3and Supplementary Table 2. Similar information for
BCRFS is provided in
Table 3 ,Supplementary Table 5, and
Supplementary Figure 4. Five-yr and 10-yr DMFS rates were
78.7% and 66.7% for EBRT, 94.6% and 89.8% with EBRT + BT,
and 79.1% and 61.5% for RP. On adjusted multivariate Cox
regression analysis, EBRT + BT offered significantly higher
systemic control compared with either EBRT (
p
= 0.0008) or
RP (
p
= 0.0003); EBRT and RP were no different from each
other. Increasing radiation dose was associated with
improved BCRFS and DMFS, while ADT duration was not
( Table 4). Neither SRT nor ART were associated with
improved DMFS. Competing risk analyses and cumulative
incidence plots for DM and BCR development are found in
Supplementary Tables 4 and 5, and Supplementary
Figures 2 and 3.
We also defined subsets of patients that received
standard of care
treatments: patients receiving doses
isoeffective to or higher than 75.6 Gy in 1.8-Gy fractions
(the high-dose arm in a randomized trial showing a
systemic control benefit to dose-escalation)
[10]and 24
mo of ADT in the EBRT cohort, patients receiving 6 mo of
ADT in the EBRT + ADT cohort, and including only patients
with appropriate multimodal management in the RP cohort
(eg, excluding patients who experienced isolated BCRs but
never received SRT). When analyses were performed in this
subset, results were essentially unchanged (Supplementary
Table 6).
3.4.
CSS and OS
Kaplan-Meier curves for CSS and OS are shown in
Fig. 2, and
results of multivariate Cox regression are shown in
Table 3and Supplementary Table 2. Five-yr and 10-yr CSS rates
were 91.6% and 80.5% for EBRT, 95.6% and 88.1% for
EBRT + BT, and 91.7% and 78.5% for RP. Five-yr and 10-yr OS
rates were 79.9% and 65.3% for EBRT, 84.7% and 59.2% for
EBRT + BT, and 90.3% and 72.1% for RP. On multivariate
analysis, no significant differences in CSS or OS were
identified (
p
>
0.1). A competing risk analysis of PCSM is
provided in Supplementary Table 3 and Supplementary
Figure 1. Multivariate Cox regression analyses, based on the
standard of care
subset defined above, were essentially
unchanged and are provided in Supplementary
Table 6. Increasing radiation dose was associated with
increased CSS. Neither ADT duration, SRT, nor ART were
associated with increased CSS or OS
( Table 4).
Table 2 – Treatment details.
EBRT
(
n
= 230)
EBRT + BT
(
n
= 87)
RP
(
n
= 170)
Radiotherapy patients
Total dose in EQD
2
,
median (range Gy)
76.4 (65–80) 88.7 (81.9–98.9)
Upfront ADT usage,
n
(%) 216 (93.9)
75 (86.2)
Duration of ADT,
median (range mo)
24 (2–56
) a8 (1–30)
Pelvic nodal irradiation,
n
(%)
176 (76.1)
68 (78.2)
RP patients,
n
(%)
Neoadjuvant systemic
therapy
18 (10.6)
Adjuvant RT
21 (12.3)
Adjuvant systemic
therapy
12 (7.1)
All patients,
n
(%)
Local salvage
2 (0.87)
1 (1.2)
73 (49.0
) bSystemic salvage
45 (19.6)
14 (16.1)
52 (30.6)
ADT = androgen deprivation therapy; BT = brachytherapy; EBRT = external
beam radiotherapy; EQD
2
= equivalent dose in 2-Gy fractions assuming an
alpha/beta ratio equal to 1.5; RP = radical prostatectomy; RT = radiotherapy.
a
Ten EBRT and six EBRT + BT patients had lifelong ADT.
b
For calculation of local salvage frequency, we excluded patients who
received adjuvant RT; however, this figure is only a crude frequency
intended to report the percentage of patients undergoing RP that
eventually received salvage RT. If restricting analysis to those patients with
biochemical recurrence but no evidence of distant metastases, the salvage
RT rate is higher (85.3%).
[(Fig._1)TD$FIG]
230 200 113 48 23 16 6 2 0
87 77 59 47 34 20 15 6 0
170 147 94 67 43 26 14 8 2
0 2 4 6 8 10 12 14 16
Time (yr)
0.0
0.2
0.4
0.6
0.8
1.0
DM-free survival probability
EBRT
EBRT + brachy
Surgery
Surgery
EBRT + brachy
EBRT
+ Censored
RP
EBRT
EBRT+BT
Fig. 1 – Kaplan-Meier curves distant metastasis (DM)-free survival. The
curves have not been adjusted for age, Gleason score, clinical stage,
initial prostate-specific antigen, year of treatment, or utilization of local
or systemic salvage therapies (with salvage treated as a time-dependent
variable). Following multivariate regression adjusted for these factors,
patients treated with external beam radiotherapy + brachytherapy
(brachy; EBRT + BT) had significantly higher 5-yr and 10-yr DM-free
survival rates than patients treated with either radical prostatectomy
(RP) or EBRT (
p
< 0.01 for both).
E U R O P E A N U R O L O G Y 7 1 ( 2 0 1 7 ) 7 6 6 – 7 7 3
769