


 762 844

bias results, we conducted a series of sensitivity analyses
with two GGG categories by randomly selecting 10%, 20%,
and 30% of patients to move from one GGG category into the
other. We found that GGG misclassification largely biased
toward to the null. However, even with 30% misclassifica-
tion in both directions, the separation between GGG
categories remained, as well as the increasing HR trend
for each GGG increment.
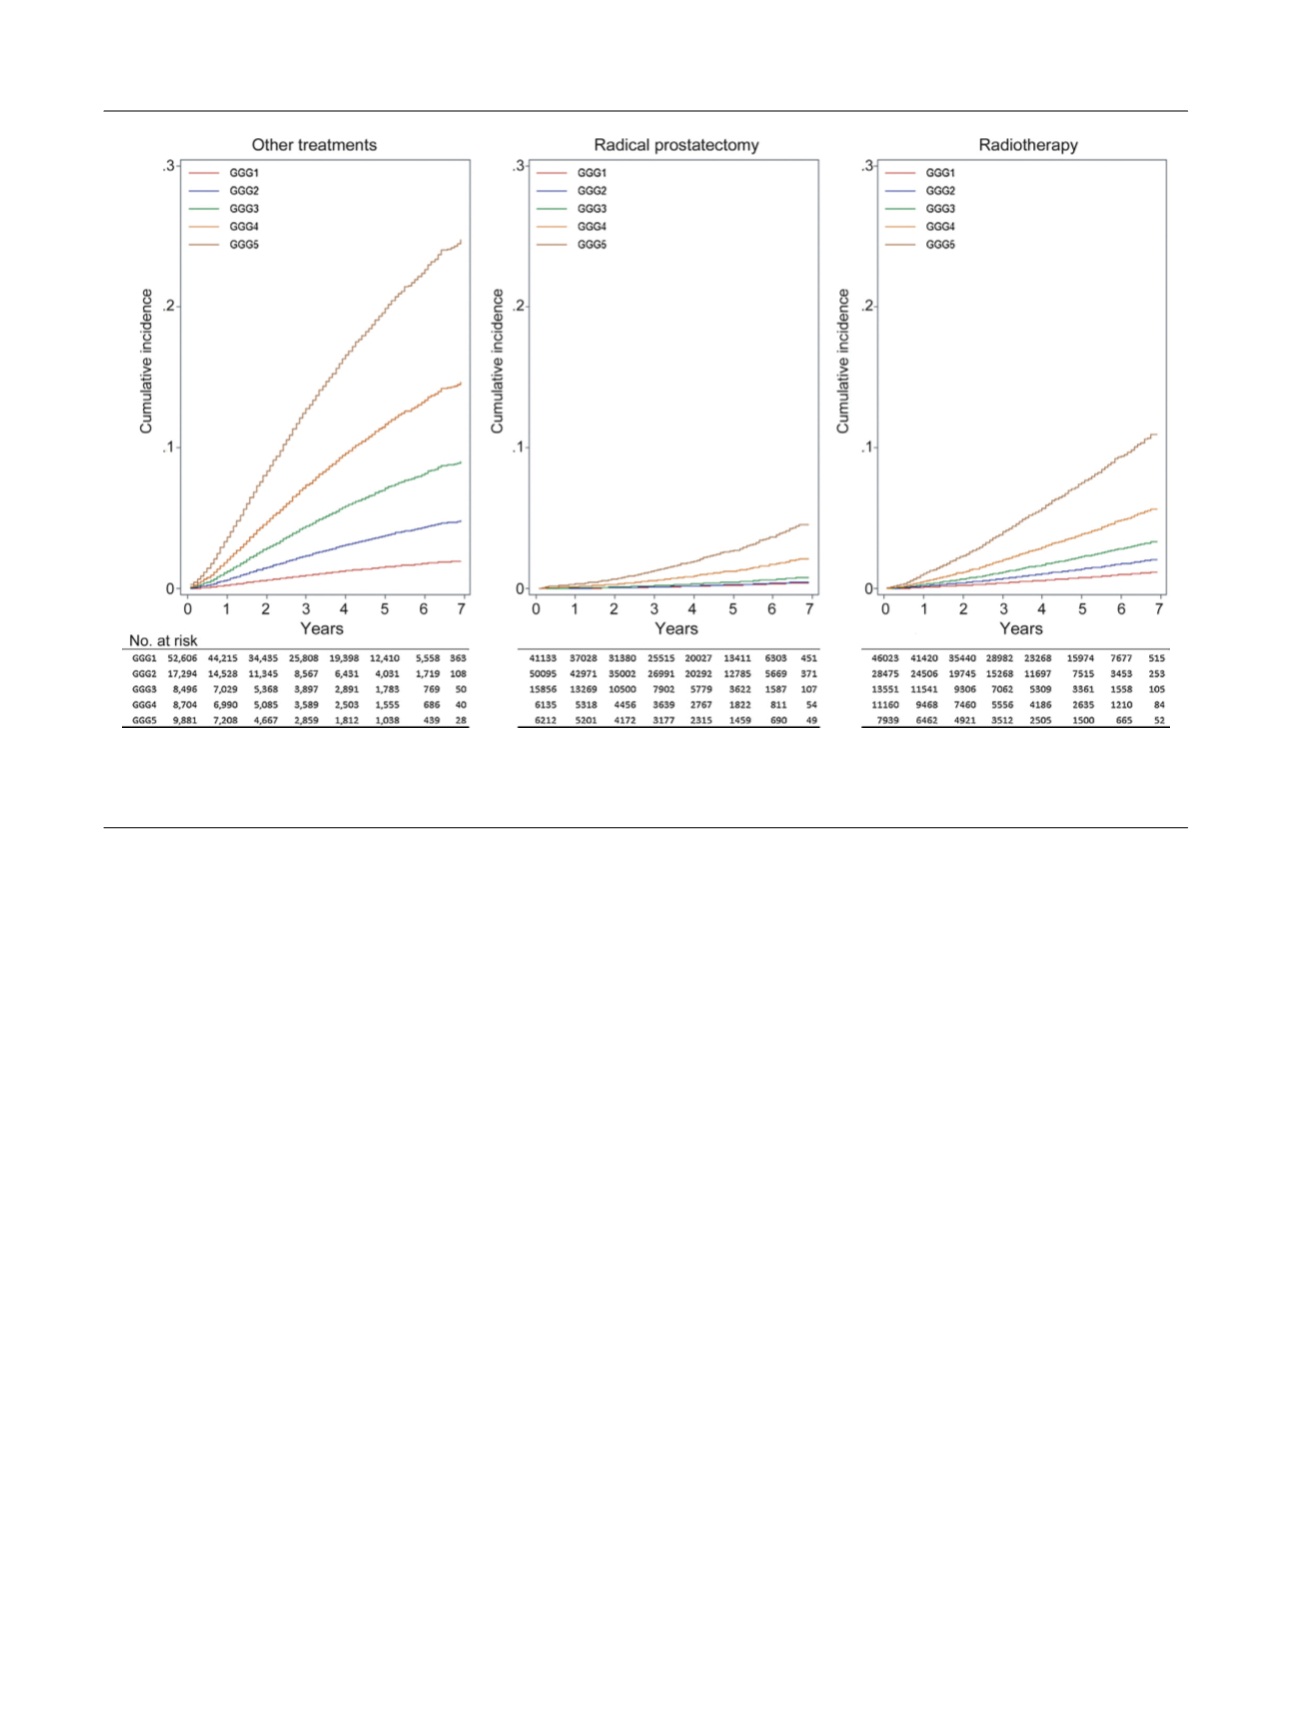
Figure 1shows the cumulative incidence of PCSM by
primary treatment received and stratified for the five GGGs.
For example, the cumulative incidence of 7-yr PCSM
following RP was 0.43% for GGG1, 0.48% for GGG2, 0.80%
for GGG3, 2.13% for GGG4, and 4.57% for GGG5 (
p
<
0.001,
log-rank test). Supplementary Figure 1 shows the cumulative
incidence of PCSMby clinical stage at diagnosis. For example,
the cumulative incidence of 7-yr PCSM for clinical stage T2
was 0.53% for GGG1, 1.01% for GGG2, 1.71% for GGG3, 3.24%
for GGG4, and 5.49% for GGG5 (
p
<
0.001, log-rank test).
The major limitations of this study include the short
follow-up and the absence of PSA data at diagnosis.
Furthermore, we were unable to determine whether
patients received watchful waiting, active surveillance,
androgen deprivation therapy, or adjuvant therapy. Despite
these limitations, our population-based analysis demon-
strates that the five-tiered GGG system can predict PCSM.
The hazard ratios differ substantially for each successive
GGG despite the absence of central pathology review. The
primary strength of this study is the large population-based
sample size with racially diverse populations reflecting real
world experiences.
Our results confirm that the five-tiered GGG system
predicts PCSM regardless of treatment received or clinical
stage at the time of diagnosis. We found that the risk of
PCSM approximately doubled with each GGG increment,
and this finding was robust.
Author contributions:
Grace Lu-Yao had full access to all the data in the
study and takes responsibility for the integrity of the data and the
accuracy of the data analysis.
Study concept and design:
He, Lu-Yao, Albertsen.
Acquisition of data:
He, Lu-Yao.
Analysis and interpretation of data:
He, Rotter, Moore, Lu-Yao.
Drafting of the manuscript:
He, Lu-Yao, Albertsen, Demissie, Moore.
Critical revision of the manuscript for important intellectual content:
He,
Lu-Yao, Albertsen, Demissie.
Statistical analysis:
He, Moore, Rotter.
Obtaining funding:
None.
Administrative, technical, or material support:
Lu-Yao.
Supervision:
Lu-Yao.
Other:
None.
Financial disclosures:
Grace Lu-Yao certifies that all conflicts of interest,
including specific financial interests and relationships and affiliations
relevant to the subject matter or materials discussed in the manuscript
(eg, employment/affiliation, grants or funding, consultancies, honoraria,
stock ownership or options, expert testimony, royalties, or patents filed,
received, or pending), are the following: None.
Funding/Support and role of the sponsor:
None.
Acknowledgments:
The authors acknowledge the administrative assis-
tance of LaTasha Pugh.
[(Fig._1)TD$FIG]
Fig. 1 – Cumulative incidence of prostate cancer– specific mortality by Gleason grade grouping and treatment. Cumulative incidence data were adjusted by
age, race, marital status, region, clinical stage (T1 vs T2 vs T3/T4), diagnosis period (2006–2009 vs 2010–2012), regional lymph node metastasis(N0 vs
others), and distant metastasis status (M0 vs others). Other treatments included watchful waiting, active surveillance, and androgen deprivation therapy.
E U R O P E A N U R O L O G Y 7 1 ( 2 0 1 7 ) 7 6 0 – 7 6 3
762