
of prostate cancer–specific mortality (PCSM). Since its
introduction, however, the original grading system has
undergone multiple revisions. Gleason patterns 1 and 2 are
rarely assigned, and glands containing cribriform growth
patterns are now classified as Gleason pattern 4. Pierorazio
et al
[2]proposed a new five-tiered Gleason grade grouping
(GGG) in which Gleason scores 6 comprise GGG1; Gleason
score 3 + 4, GGG2; Gleason score 4 + 3, GGG3; Gleason score
8, GGG4; and Gleason scores 9 and 10, GGG5. Validation
studies have shown that the new system predicts the risk of
biochemical recurrence–free survival and recurrence-free
progression
[2–4]. To date, however, no studies have
assessed whether the new system predicts PCSM. This
population-based study was undertaken to assess whether
the five-tiered GGG system predicts PCSM using Surveil-
lance, Epidemiology, and End Results (SEER) data.
We identified men diagnosed with prostate cancer
between January 1, 2006 and December 31, 2012
(
n
= 408 396) from the SEER database, as major Gleason
scoring revisions were adopted at the 2005 International
Society of Urological Pathology Consensus Conference
[5]. Patients who did not have both primary and secondary
patterns recorded (
n
= 45 101), patients diagnosed with
prostate cancer at the time of death (
n
= 31 852) and
patients with missing survival data (
n
= 55) or of pediatric
age (
n
= 68) were excluded. The final study cohort totaled
331 320 patients. PCSM data were available up to December
2012.
For patients undergoing radical prostatectomy (RP), the
Gleason pattern was based on a surgical specimen.
Otherwise, the biopsy-based Gleason pattern was used.
We analyzed survival data by cancer treatment received
within 1 yr of cancer diagnosis and by clinical stage (T1,T2,
and T3/4). If a patient receivedmore than one treatment, the
treatment group was assigned using the following hierar-
chy: RP, radiotherapy, other treatments. Patients may have
received subsequent therapy, such as salvage radiation or
prostatectomy, and probably received hormonal therapy
before they died from prostate cancer.
Multivariate competing-risks hazard ratios (HRs) and
confidence intervals (CIs), as well as cumulative incidence
estimates, were computed using the Fine and Gray propor-
tional hazards (PH) model for subdistributions
[6]. GGG1
(Gleason score 6) was chosen as the reference group. The
multivariate competing-risks PH model accounted for age,
race, marital status, geographic region, diagnosis period
(2006–2009 or 2010–2012), regional lymph node involve-
ment, and metastasis status. Data for prostate specific
antigen (PSA) values at diagnosis were unavailable
[7].
All analyses except for competing risks were performed
using SAS version 9.2 (SAS Institute Inc., Cary, NC, USA). Fine
and Gray competing risks models were fitted using the
stcreg
procedure in STATA version 14 (StataCorp LP, College
Station, TX, USA).
Reclassification of the study cohort according to the
proposed five-tiered GGG system resulted in the following
distribution: 43.3% for GGG1, 29.5% for GGG2, 11.7% for
GGG3, 8.1% for GGG4, and 7.5% for GGG5. Most patients
received either RP (36.4%) or radiation therapy (32.6%) as
primary therapy. During the follow-up period, 9198 of
patients died from prostate cancer and 19 482 died from
other causes. The median follow-up was 38 mo (inter-
quartile range 18–60). The number of patients followed for
at least 5 yr was 40 238 for GGG1, 23 331 for GGG2, 8423 for
GGG3, 5784 for GGG4, and 3803 for GGG5. Characteristics
for the 331 320 men are summarized in Supplementary
Table 1.
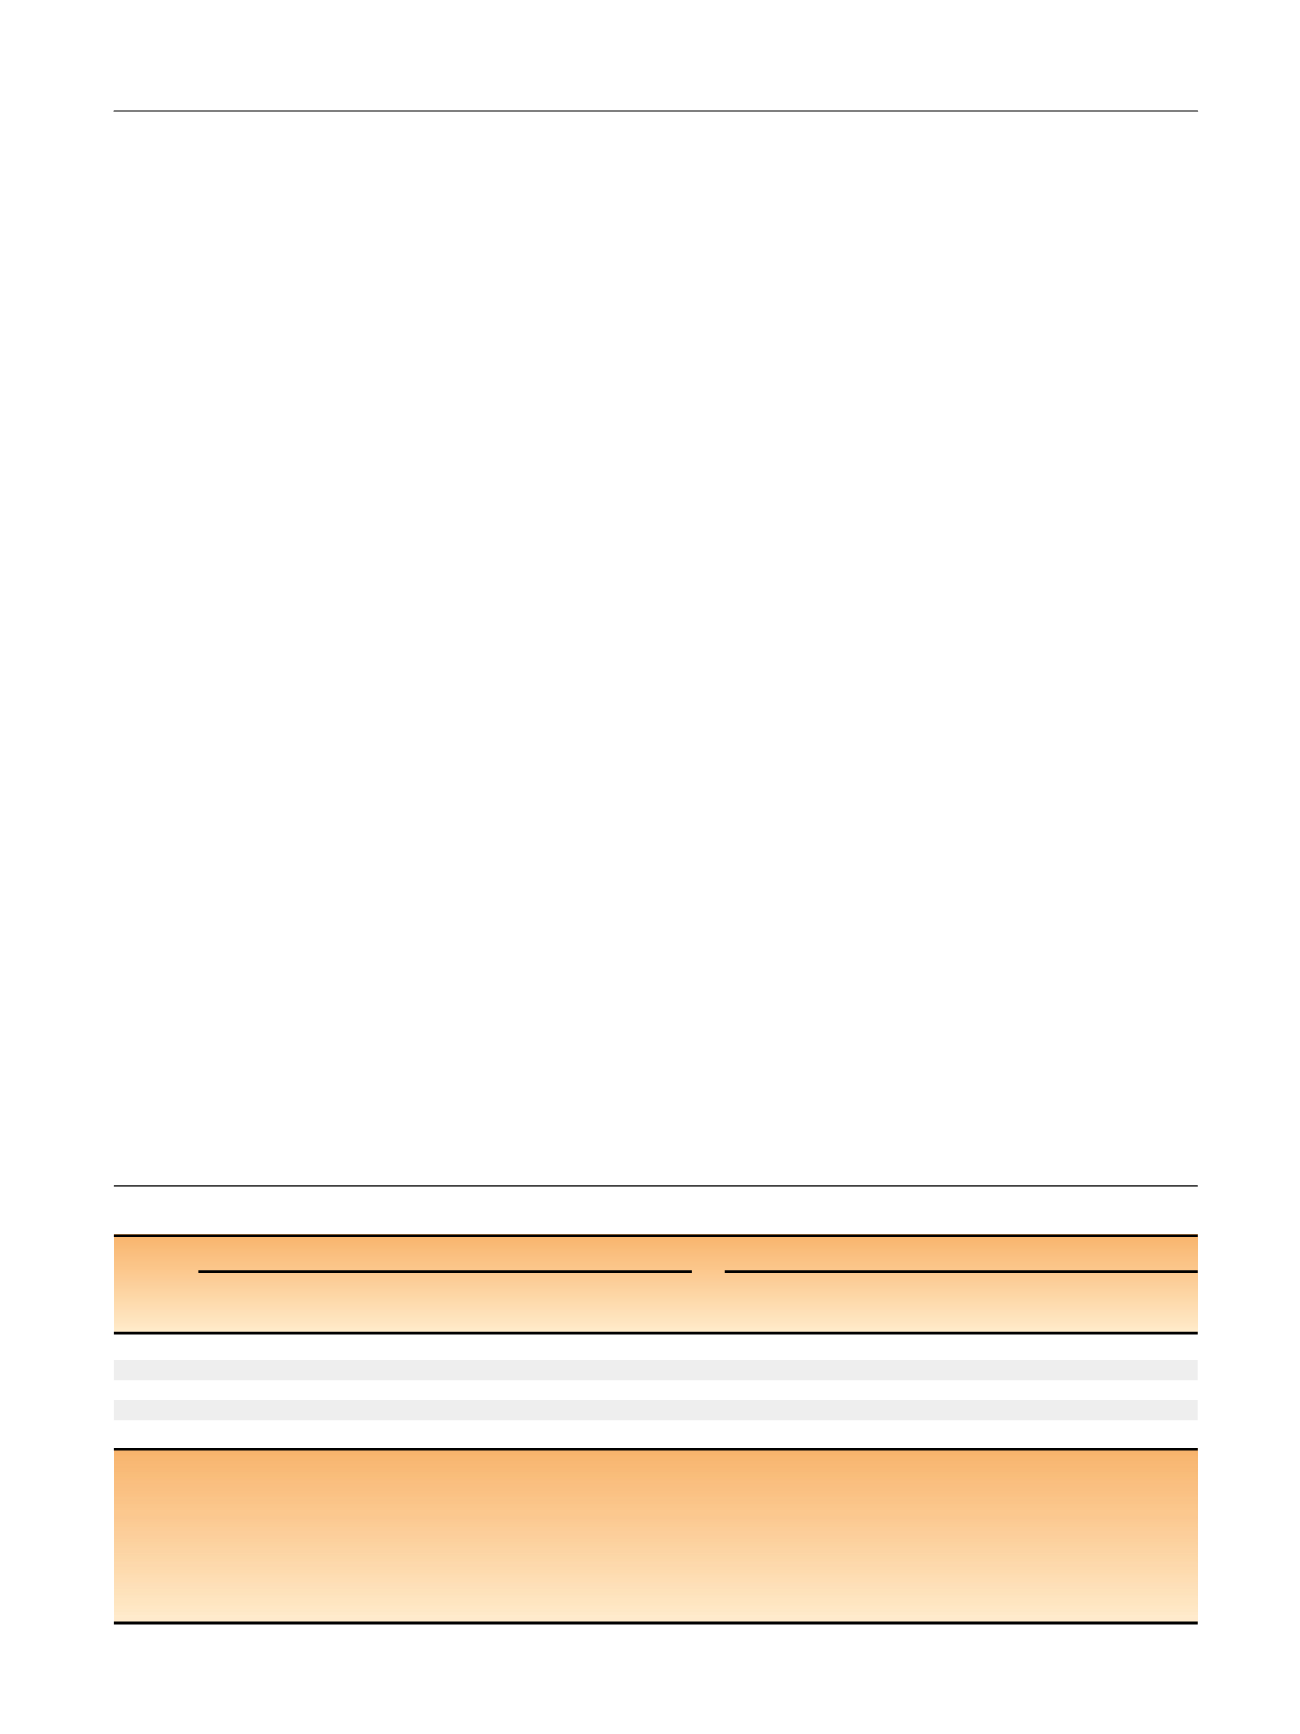
Using GGG1 as the reference group, the PCSM hazard
ratio increased with each GGG increment, regardless of the
primary treatment provided. For example, men who
underwent RP the adjusted hazard ratio was 1.13 (95% CI
0.83–1.54) for GGG2, 1.87 (95% CI 1.33–2.65) for GGG3, 5.03
(95% CI 3.59–7.06) for GGG4, and 10.92 (95% CI 8.03–14.84)
for GGG5. The HR approximately doubled for each GGG
increment and differed significantly from each of the others.
Similar patterns were observed for the radiotherapy and
other treatment groups, and for models by clinical stage
( Table 1 ). As variability in Gleason pattern assessment may
Table 1 – Results of competing-risks regression for prostate cancer–specific survival by Gleason grade grouping (GGG
) dGGG
By treatmen
t aBy clinical stag
e bOther treatment
s cRadical prostatectomy
Radiotherapy
Stage T1
Stage T2
Stage T3/4
HR (95% CI)
HR (95% CI)
HR (95% CI)
HR (95% CI)
HR (95% CI)
HR (95% CI)
GGG1 Reference
Reference
Reference
Reference
Reference
Reference
GGG2 2.48 (2.18–2.83
) *1.13 (0.83–1.54)
1.78 (1.51–2.09
) *1.92 (1.67–2.21
) *1.90 (1.64–2.21
) *1.27 (0.82–1.96)
GGG3 4.74 (4.16–5.40
) *1.87 (1.33–2.65
) *2.88 (2.42–3.43
) *3.46 (2.99–4.02
) *3.24 (2.78–3.78
) *2.36 (1.55–3.62
) *GGG4 7.94 (7.03–8.97
) *5.03 (3.59–7.06
) *4.98 (4.24–5.84
) *5.78 (5.04–6.63
) *6.19 (5.37–7.13
) *3.78 (2.49–5.73
) *GGG5 14.22 (12.61–16.04
) *10.92 (8.03–14.84
) *9.88 (8.38–11.63
) *12.61 (10.99–14.47
) *10.61 (9.22–12.22
) *6.96 (4.64–10.46
) *HR = hazard ratio; CI = confidence interval.
*
p
<
0.05.
a
Treatment models were adjusted by age, race, marital status, region, clinical stage (T1 vs T2 vs T3/T4), diagnosis period (2006–2009 vs 2010–2012), regional
lymph node metastasis (N0 vs others), and distant metastasis status (M0 vs others).
b
Clinical stage models were adjusted by age, race, marital status, region, treatment (RP, radiotherapy, or other treatments), diagnosis period (2006–2009 vs
2010–2012), regional lymph node metastasis (N0 vs others), and distant metastasis status (M0 vs others).
c
Other treatments included watchful waiting, active surveillance, or androgen deprivation therapy.
d
For patients with RP the Gleason pattern was based on a surgical specimen. Otherwise, biopsy-based Gleason pattern was used.
E U R O P E A N U R O L O G Y 7 1 ( 2 0 1 7 ) 7 6 0 – 7 6 3
761


